MemInfo is a minimalistic task manager that sits in the system tray
We have reviewed plenty of process managers, e.g. Proccss Explorer, MiTec Task Manager Deluxe, SterJo Task Manager, or but none of them are quite as minimalistic as MemInfo. It's a handy tool for monitoring the memory usage.

MemInfo's installer weighs about 650KB, and has an option to install the program as a portable application. Run the program and it will appear on the system tray.
The icon has a bar on it which fills up to reflect the amount of physical memory currently used by the computer. It also displays a number representing the physical memory used (in terms of GB).

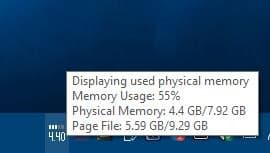
So you don't need to open Windows Task Manager to see how much RAM is being used. You can tell it by just glancing at the icon. But there's more, mouse over the icon to view a tool tip that shows the Memory Usage in %, physical memory usage and page file usage.
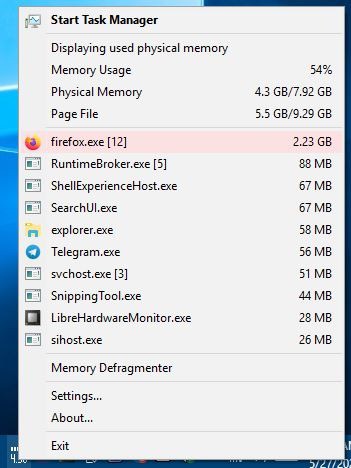
Right-click on MemInfo's icon to view a context menu. The first option is a shortcut to open the Windows Task Manager, though you can just double-click the icon to do this. The section below it displays the same information that's displayed when you mouse over the tray icon.
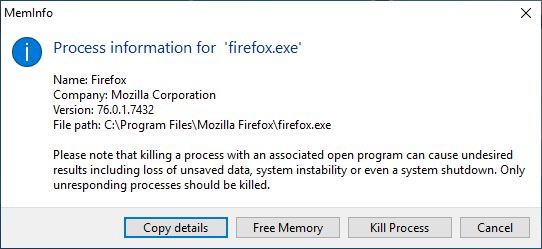
The third part of the menu displays the list of processes which are consuming the most of your computer's memory. It lists the top ten apps that are resource intensive. Click on a process to bring up a pop-up window that displays its name, file path, version and some other information. You may use the "Copy Details" button to save the information to the clipboard. The window can also be used free the memory used by the program or kill the process (end task).
Next is the Memory Defragmenter, which frees up some used memory. Personally, I'd rather close heavy programs. Click on the Settings menu item to open the MemInfo Settings window. The General tab has customization options for the tray icon.
As I mentioned earlier the tray icon displays the physical memory used by the system. You can however change it to display the page file memory, or the amount of free memory left (not being used). If you'd rather prefer to view a percentage value of the memory instead of GB, you can enable the setting for the same.
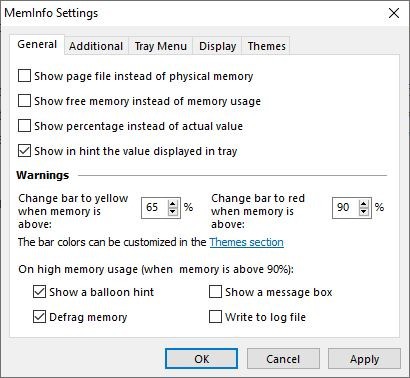
MemInfo can warn you when your computer's memory is running low. There are two thresholds for this, both of which are customizable. The first option changes the color of the tray icon's bar to yellow, when the memory is above 65%. The other option changes it to red when 90% or more of the memory is used. If in case of the latter (memory usage is 90%), the program will display a balloon hint to alert you about it. The program also defrags the memory automatically, though you can disable both of these options. You may want to enable the "Show a message box" and/or "Write to log file" options to be triggered when the memory usage is extremely high.
The next tab is Additional Settings and it houses options to automatically defrag the memory every N number of minutes. Assign a hotkey to defrag it manually.
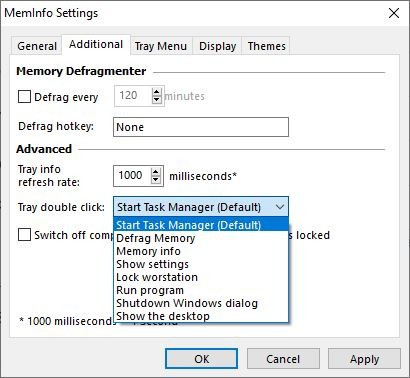
The MemInfo tray icon updates in real-time (1000 ms or 1 second), you can modify this from the Additional settings. Change the behavior of the tray icon double click to one of these: Start Task Manager, Defrag Memory, Memory Info, Show Settings, Lock Workstation, Run Program, Shutdown Windows Dialog, or Show the Desktop.
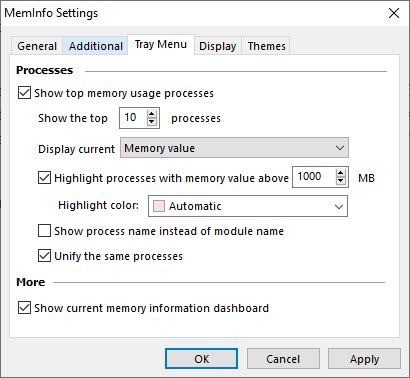
Head to the Tray Menu tab to customize it. Want to see more than 10 processes in the list? Change it. Display the current memory value, or percentage or both.
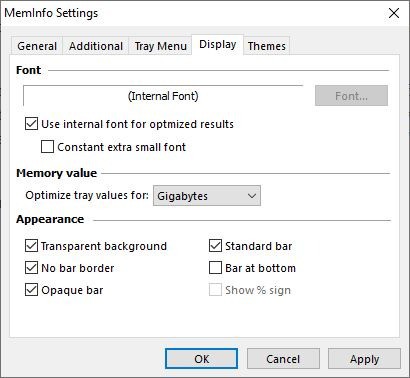
Next is the Display tab. Use it to change the font of the MemInfo tray icon, switch from Gigabytes to Megabytes. The appearance of the icon can be customized with toggles for transparent background, opaque bar, bar at bottom, standard bar (changes from blocks to a line bar), no bar border, and show % sign.
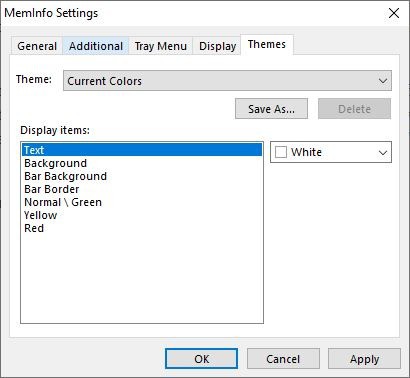
The Themes tab has even more customization options, to be precise to change the color of the icon's background, text, bar background, bar border, normal memory usage, yellow (threshold 1) and Red (threshold 2).
While it may not be powerful as the more advanced task managers out there, MemInfo can be useful for monitoring the memory usage of programs.









I’m trying it. I’m new to win10 “os” and it’s billions of stupid little processes (and am about to kick it to the curb —fax?! Really MS? Whatever.) I like process mgr (sysinternals) but I know the hogs and sometimes I have to just get some stuff done and not chase down leaks (open a sloppy program and get as much done in half an hour as possible; close and reopen). Still, a little concerned that old somewhat-stables (Vivaldi on win10; the GE settings console app (rem) and all those “metro” apps) can be dark horses in the mem usage >70% REBOOT race to the crash :( bsod.
I have two active laptops now. One is “running” Win10pro. I think I’ll give this lil meminfo a whirl. Thx.
Tested for the first time: Unified Brave OK (37 processes) = 3.74GB
Thank you for your answers.
“Unify single process†works only sporadically, eg. last night Chrome was reported as using ~100MB, in reality it totaled a little over 8GB. Other times it can be reasonably accurate.
It’s normally quite useful/fairly accurate for a quick check.
The “Unify single process” option doesn’t really work. It displays the memory usage of one of the instances, not even the one using most memory. But I like the program, I hope they fix this bug.
Can it sum up the memory used by all the processes run by a single program ? I find it very frustrating that this figure is usually impossible to assess, with browsers having multiple concurrent processes.
Yes, it can consolidate all processes belonging to aprogram, and summarize their RAM use.
It looks something like this:
firefox.exe [6] 718 MB