How to see CPU, GPU and RAM usage on Windows 11

To see CPU, GPU and RAM usage on Windows 11, press Ctrl+Shift+Esc to open Task Manager and select Performance: it shows live graphs for CPU, Memory and GPU. For an on-screen overlay that stays visible over other windows, press Windows+G to open the Xbox Game Bar, open the Performance widget and select its pin icon. Both tools are built into Windows 11, so you do not need third-party software.
This guide covers both native methods, how to keep a CPU and RAM monitor on top of other windows, how to check GPU usage per app, and when Resource Monitor is the better tool.

How to check CPU and RAM usage in Task Manager
Task Manager is the quickest way to check CPU and RAM usage on Windows 11, and it opens with the Ctrl+Shift+Esc shortcut. You can also right-click the Start button and select Task Manager.
- Press Ctrl+Shift+Esc.
- Select Performance in the left navigation pane.
- Select CPU to see total utilization, speed, cores, logical processors and uptime.
- Select Memory to see RAM in use, available memory, committed memory and speed.
- Select Processes to sort running apps by the CPU or Memory column and find the app that uses the most.
The Processes, Performance and Users pages now report CPU usage with the same formula. Microsoft changed this in Windows 11 24H2 with the optional KB5064081 update in August 2025: before, the Processes page used a different metric, so its numbers often did not match the Performance graph or third-party tools. If you prefer the old value, the Details tab has an optional CPU Utility column (right-click a column header and choose Select columns).
If one process keeps the CPU busy in the background, our guide on what wsappx is and why it causes high CPU load explains one common case.
How to check GPU usage on Windows 11
Windows 11 shows GPU usage in Task Manager under Performance > GPU, with separate graphs for engines such as 3D, Copy, Video Encode and Video Decode, plus dedicated and shared GPU memory. Systems with two graphics adapters list them as GPU 0 and GPU 1.
To see which app uses the graphics card, open the Processes tab: the GPU column shows the load per app, and the GPU engine column (add it with a right-click on a column header) shows which adapter and engine the app runs on. If a game or app runs on the wrong adapter, you can assign a graphics performance preference to the program in Settings.
The GPU page shows several small engine graphs, and each one has a drop-down that picks the engine it displays. If a graph looks low while a game or AI app is busy, it may be set to an idle engine: switch its drop-down to 3D or Compute.
How to show a CPU, GPU and RAM overlay with Xbox Game Bar
The Xbox Game Bar Performance widget is the native way to show CPU, GPU and RAM usage as an overlay on Windows 11. It works on the desktop and in games, and it can stay on top of other windows.
- Press Windows+G to open the Xbox Game Bar.
- Select Performance in the top widget menu if the widget is not already shown.
- Read the live values for CPU, GPU, VRAM, RAM and, in games, FPS.
- Select the pin icon in the widget's title bar.
- Click anywhere outside Game Bar: the pinned widget stays on screen.
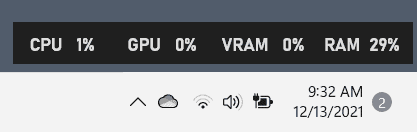
Without the pin, the overlay closes as soon as you click elsewhere. Note that you can only move the widget while Game Bar is open. If Windows+G does nothing, check Settings > Gaming > Game Bar and make sure the Xbox Game Bar app is installed from the Microsoft Store.
Game Bar also has a Resources widget that lists the apps using the most system resources and rates them as low, medium or high, which helps when you want to find a resource hog without leaving a game.
How to customize the Game Bar performance widget
The Performance widget has its own options for position, metrics, color and transparency. Open Game Bar with Windows+G and select the options icon in the widget's title bar.
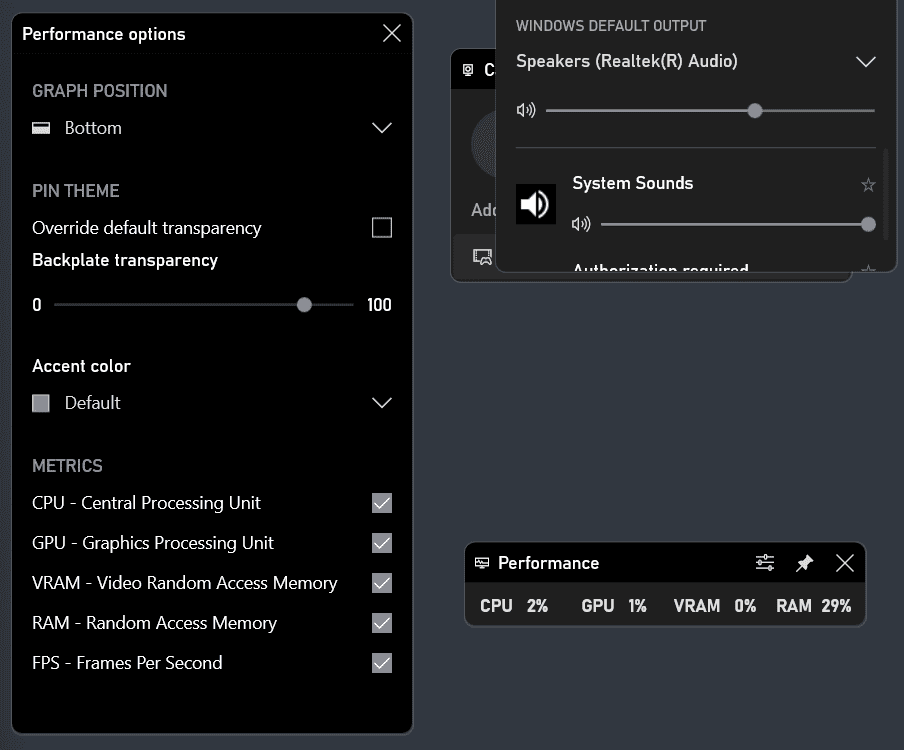
- Graph position: show the usage graph to the left, right or not at all.
- Metrics: hide values you do not need, for example FPS on the desktop or VRAM on a system with integrated graphics.
- Accent color and transparency: make the overlay less distracting or easier to read over bright content.
A compact widget with the graph hidden takes up very little space, so many users place it near the taskbar, where it works as a small CPU and RAM monitor. Hover over the pinned widget and use the arrow icon to collapse or expand the graph.
The pinned state does not always survive a restart or sign-out. If the widget is gone after a reboot, press Windows+G and pin it again.
Can Windows 11 show CPU and RAM usage in the taskbar?
Windows 11 has no built-in setting that prints CPU or RAM values in the taskbar. Two native workarounds come close:
- Pin the Game Bar Performance widget and place it next to the taskbar, as described above. This was first noted by our colleagues at Deskmodder.
- Keep Task Manager running: its notification area icon shows a small CPU usage meter. In Task Manager Settings, turn on Hide when minimized, then minimize the window to keep only the icon.
For a floating mini monitor, open Task Manager, go to Performance, right-click a graph and select Summary view, then turn on Always on top in Task Manager Settings. The result is a small window with CPU, Memory, Disk, network and GPU values that stays above other apps. The redesigned Windows 11 Task Manager moved the tabs to a left pane, but these options remain in place.
Task Manager, Game Bar or Resource Monitor: which to use
Use Task Manager for a quick check, Game Bar for an always visible overlay and Resource Monitor for detailed troubleshooting.
| Tool | Open with | Best for |
|---|---|---|
| Task Manager | Ctrl+Shift+Esc | Totals, per-app CPU, RAM and GPU, ending a process |
| Xbox Game Bar | Windows+G | Pinned overlay with CPU, GPU, VRAM, RAM and FPS |
| Resource Monitor | resmon in the Run box (Windows+R) | Per-process memory, disk and network detail |
Resource Monitor does not show GPU usage, but it explains where memory goes (in use, modified, standby, free) and which files and connections a process uses. Our detailed Windows Resource Monitor guide covers every tab.
FAQ
What is the shortcut to see CPU usage on Windows 11?
Ctrl+Shift+Esc opens Task Manager, where Performance > CPU shows live usage. Windows+G opens the Xbox Game Bar, whose Performance widget shows CPU usage as an overlay.
Why does the Game Bar Performance widget not show GPU or FPS?
FPS appears only while a game is in focus, and you may have hidden a metric in the widget options. Updating the Xbox Game Bar app and the graphics driver fixes most missing GPU readings.
Does the Game Bar overlay slow down games?
The widget reads the same counters as Task Manager and has little overhead on most systems. If you notice a drop, unpin it while playing and check the numbers afterwards.
Related: Windows Resource Monitor guide, enable the Ultimate Performance power plan, set graphics preferences per app

How do I do this?
In your image, it shows everything in a horizontal line and covers less space. For me, on Windows 11, it shows a rectangle box and I don’t see any options to change or customize the box size. I want it to be thin like you have.
Thanks.
I still use core temp. Very tiny taskbar utility that does a lot of this.
I don’t understand. In Windows 10 you see most of these entries when opening task management. Why bother with the game bar. Maybe that is not enough for people, depending on their needs, but it would be nice had you mentioned it.
You lost me when it said “game bar”
Never turn that on if you know what’s good for you
Disable, or remove it, possible ?
Saving cpu cycles, for better gaming performance..
Nah, I’m good.
I’m still using the All CPU meter gadget on my 2nd monitor (https://gadgetsrevived.com/) to monitor CPU and Memory usage.I also have the little calender up and a tiny digital clock.
If I’m dialing in max settings for a new game I pop open Afterburner to watch my GPU stats.
I love the cleanmem mini monitor, the process explorer and core temp.
All work and positioned in the far right from the taskbar.
https://www.makeuseof.com/tag/cleanmem-a-memory-cleaner-that-works/
Wouldn’t use on SSD Drives !!