VenMon is a system monitor program with a minimalistic widget and a multi-ping tool
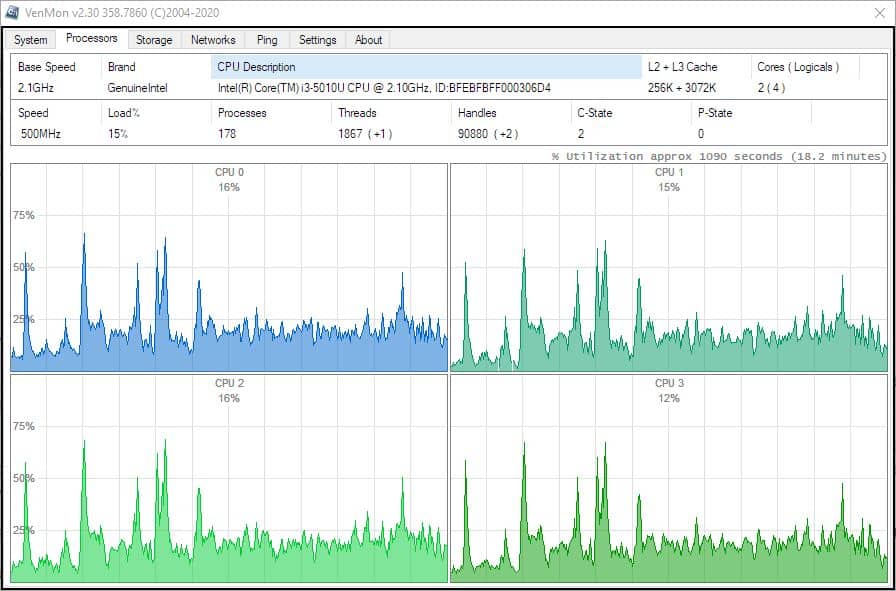
Monitoring your computer's performance is a good way to ensure everything is working as intended. There are many tools you can use for this.
VenMon is a system monitor program that has a minimalistic widget and a multi-ping tool.
The program places a floating widget on the screen, which you can drag it anywhere you like. The interface stays on top of other windows, though this can be toggled from the settings page. The VenMon GUI has a minimalstic approach thanks to the button-less, toolbar-less design. Instead, it has colorful text meters. There is a lot of information on that little pane, it can be a little confusing at first.
"Phys" refers to the physical memory that's available on your computer, aka the free memory. It is displayed in Megabytes and %. Next is the Page file memory, also using the same units. VenMon indicates the current CPU usage, battery percentage, system uptime, idle time. There is a ping meter, which we'll get back to later. The R and W in the interface are the hard drive's read and write activity. The application lists each partition and drive on your computer, with the amount of free space and total space, in both Gigabytes and percentage.
Clicking on any of the meters in the VenMon widget opens a pop-up window that loads the relevant page in the program's secondary interface. Technically, this GUI offers a lot more information that the widget.
The window has seven tabs: System, Processors, Storage, Networks, Ping, Settings and About.
The System tab gives you information regarding your computer's components such as the processor model, memory, graphics card, display resolution, operating system, username and computer name. A real-time graph is displayed for monitoring your CPU and memory utilization. The sidepanel to the right edge lists the system events along with the usage charts for the CPU, physical memory and page file memory.
Processors, the second tab in VenMon can be used to identify your CPU's base frequency, model, cache and cor information. The tab has real-time graphs exclusively for monitoring each CPU core. View your hard drive's stats under the Storage tab. There is yet another graph here, this time for monitoring the data read and write speeds. The menus at the top can be used to switch the unit or to monitor specific drives/partitions.
Check your internet adapter's properties, monitor the network usage, speeds from the Network tab.
The Ping tab is VenMon's multi-ping tool. Instead of using the Ping command in CMD, you can ping multiple servers at the same time quickly using this utility. There is an option to switch between host name and IP address, as well as settings to change the time interval between pings.
To add a host name/IP enter the relevant information in the text field at the top and click on the + button. - removes the selected host, while // resets all hosts. The icon at the far right corner displays the countdown timer for the ping process.
Head to the Settings tab and you can customize VenMon to some extent. Enable sound alerts, set the window transparency or make the widget truly minimal by toggling "Borderless Window".
Other options that you can choose include "Always on Top" mode, real-time monitors for memory and network, extended history, detailed ping timeline, etc.
The program has an icon on the system tray, that can be used as a shortcut to bring the widget back into view, if you minimize it. There are many keyboard shortcuts that you can use to access the various tools in VenMon, learn about them at the official webpage.
VenMon is available in a portable format that contains the 32-bit and 64-bit executables. It is compatible with Windows 7, 8, and 10.
My only complaints regarding it are that it doesn't read the thermal levels (CPU, GPU temperature), and you can't resize the widget, or change the font sizem type or color. The tray icon displays just one hard drive's stats, a more informative tool-tip with additional stats would be welcome.









So where do you get it?
The link is in the summary box below the article, as usual.
Thanks for sharing Its much more lighter and faster than LibreHardwareMonitor. I might make the switch fully to VenMon.
I’m still using Gadgets though I have to reinstall them every single phooking time windows does a feature update. I have them on my secondary monitor; Calender, My Tiempo, and All CPU Meter.
The CPU meter can do temps with a small support app running but it would be redundant on my system as I have the MSI command center running. It monitors much more then temps (all user configurable) and will sound an alarm and/or shut down the PC if anything gets out of range.
VenMon turned out to be an excellent tool- portable version available, tiny size, light resource usage, neat interface. I am glad that there are still skillful developers who craft such nice stuff- no bloat and dependencies (no .NET, no Java, no Electron), sane design and reasonable set of features.