View the CPU, RAM and network usage on the Taskbar with Perfmonbar
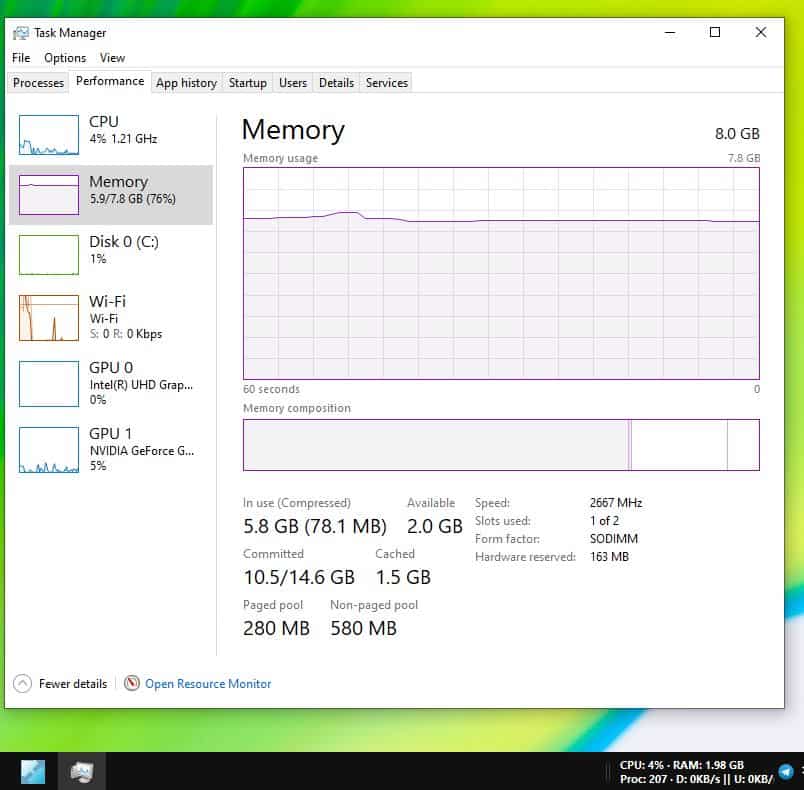
What do you do when you feel that your computer is lagging? If you're like me, you will probably open the Task Manager to see what's wrong.
Usually, most users observe the CPU or RAM usage, and close any programs that maybe bogging down the system.
But sometimes your computer can experience a micro stutter when a program opens, or if your antivirus decides to run a scan randomly, and so on. It may be useful to know the resource usage at a glance, without running the Task Manager.
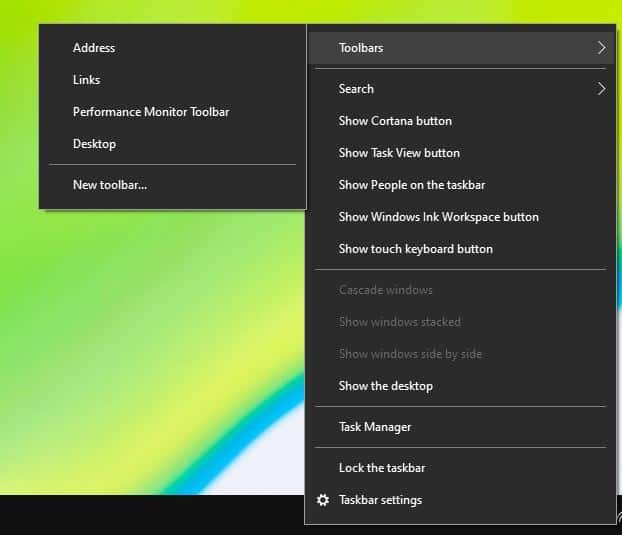
Perfmonbar is a tool can help you do that. Install the application, and right-click on the Taskbar. Navigate to the Toolbars menu and enable the Performance Monitor Toolbar. (refer to the image above)
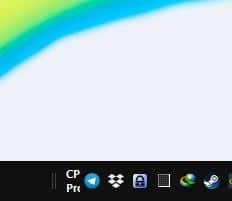
The toolbar will appear next to the system tray. It only has a couple of letters on it by default, which is not how it is supposed to look like. Mouse over the lines to the left of the toolbar, click and drag it to expand the deskband.
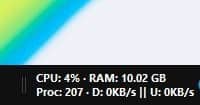
Perfmonbar displays 4 performance counters. One of these is for the CPU Usage, which is shown in percentage. The RAM usage is reported in Gigabytes. The issue here is that the memory usage shown by the toolbar is not just your physical memory, instead it is the Committed memory (that you can view from Task Manager > Performance > Memory). You can change this to show the available memory and more, we'll get back to this later.
The program tells you how many processes are running, both in the foreground and the background. The 4th counter is for the network, and displays the Download and Upload stats, in terms of KB/s (Kilobytes). By default, it is set to display the Ethernet adapter's usage. There is a fifth counter in Perfmonbar, and it is hidden. To view it, click on the toolbar and you will see the amount of storage space that is free on your computer's hard drive.

Perfmonbar uses Window's built-in Performance Monitoring Counters to display the stats in real-time. You can find all available counters supported by Windows with a simple command. Open CMD and enter the following typeperf -q>counters.txt. This will save the list of available counters in a text file in your Users folder.
The settings of Perfmonbar are stored in a Config.XML file. It is very customizable, and you can use it to modify the display font type, size, color, and also the counters that are displayed on the toolbar.
Let's make a couple of changes. I want the toolbar to show the available memory (instead of the commited memory). Open Perfmonbar's Config.XML in any text editor, you can do so by right-clicking on the toolbar and selecting "Edit configuration" and look for the line that says,
<counter name="mem" value="\Memory\Committed Bytes"/>
Change the value to \Memory\Available MBytes, so it should read,
<counter name="mem" value="\Memory\Available Bytes"/>
Hit the save button. If the toolbar is running, use the "Reload Configuration" from its menu. The toolbar will now display the amount of free RAM that is available.

Let's change the network counter to display the current Wi-Fi usage instead of LAN. Open Windows' Device Manager, navigate to Network Adapters. Select your Wi-Fi adapter > Properties > Details. Right-click on the adapter's name in the value pane and select copy.
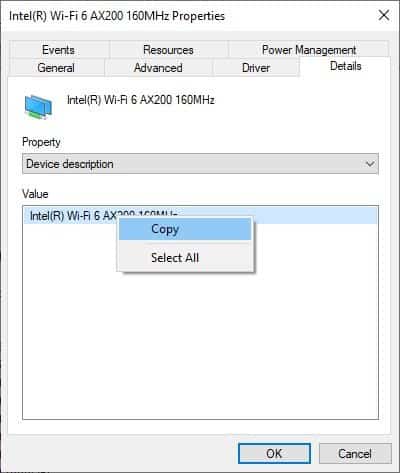
Paste it in the XML file, look for the counters that are named "netin" and "netout". There is one change that you will need to make to get it working. If your network adapter has parentheses (), replace them with square brackets [].
For e.g my adapter's name is an Intel(R) Wi-Fi 6 AX200 160MHz. I'll have to edit it, so the counter will look like
<counter name="netin" value="\Network Interface(Intel[R] Wi-Fi 6 AX200 160MHz)\Bytes Received/sec"/>
You can add and remove counters as you like by editing the Configuration file. Take a backup of the file before editing it.
Perfmonbar is an open source project. It is not portable.










Nice utility. I push my computer to its limits and I tend to ignore warning glitches until it’s too late. I think that I run out of available RAM and then it freezes. I can hopefully catch a glimpse of my available RAM and take action before it’s too late.
There’s a slight error in the example given above. You should change to value=”\Memory\Available Bytes”/ and not \Memory\Available MBytes. You’ll then get the correct display for your available RAM in GB.
Still cant show how much ram is in use. Only thing I want. Not free ram not % used because all of those just make me have to calculate how much is actually being used in my head vs total ram.
This looks really cool, one suggestion though, would’ve been nice if you had measured the RAM usage of the tool, eg compared to Process Explorer or Task Manager. Cheers!
For anything monitoring of system resources I still use Process hacker and the tray icons. The only advantage I see on this is how you can see the download and upload network stuff, but it is not something I can’t see once I go to Process Hacker window if i really care to see download and upload rate.
I used to use Tinywall for the network rate, but now I only use Windows firewall since I can just use powershell to enable and disable stuff easily.
This looks nice but not something I really need, especially if I have to go and edit xml stuff just to get the same information I can get with PH (minus the Network numbers of course).
System Explorer 7.1.0 still meets my needs even though it’s over 4 years old. If I need more info (rare) I use Task Manager in Microsoft Windows [Version 10.0.18363.1016]. I like System Explorer because on Power On after a Shutdown, it’s easy to see when activity is really complete, which can be at least several minutes.
> Like you I imagine? Probably an insecure Linux user thing.
It sounds like some poor little Windows user needs a HUG!
It’s nice to have info like this in simple form on the taskbar but I’ve never had any real use for it day to day. There have been some situations where these stats were valuable:
Video editing. Rendering can easily peg memory in complex projects; maybe more memory is a good investment, maybe you’re already maxed out and a new computer is the way to go.
Video playback codecs. When I first began using MadVR, playback of 4K and very low res vids with various renderer settings showed some settings combos saturated my video card. Experimenting a bit revealed settings that gave excellent playback performance while staying below about 90%.
For both scenarios, I used Task Manager, then closed it.
There have been one or two instances of pinned CPU’s with nothing running; a matter of looking at processes/services in Task or Resource Manager, killing the hoggy ones, then going online to see what’s going on.
I suppose he’s aware of rootkits that aim at side-channeling such monitoring tools to get into the system and e.g. mine crypto or whatever.
Real men use conky.
/thread
Don’t thread on me.
Like you I imagine? Probably an insecure Linux user thing.
Rootkit infections laugh at this sort of monitoring and are completely invisible to them
It’s nice to see that my comment on this subject was deleted. Both SmartScreen and Norton 360 flagged very dangerous behavior on this app that did not work at all on Windows 10.
This is my last comment on this site…
Just tried it… SmartScreen alerted about but Norton 360 gave a ok… Just did not work as expected in W10. Upon uninstall all the beauty was revealed as Norton blocked with highest danger mark activity in: Users\Admin\AppData\Local\Temp\_iu14D2N.tmp —- a process tried to delete a protected archive (by Norton).
As I know Norton for more than 20 years I have to believe something is wrong.
I was not logged as Admin so there was some sneaking about…
Please elaborate on your speculation.
This isn’t speculation. Simply look up the Wikipedia article on rootkits and real about how they work.
More better to use desktop gadjets with cpu/video/network usage from addgadjets(.)com and set transparency to 60-70%
Something like this for Linux (KDE or Cinnamon)?
Yeah, Conky is sort of the universal Linux System Monitor.
There is another one:
http://gkrellm.srcbox.net/
BGInfo for Windows, but limited stats.
…Conky?… and so much more plugins for taskbar