Mozilla improves about:performance page in latest Firefox Nightly
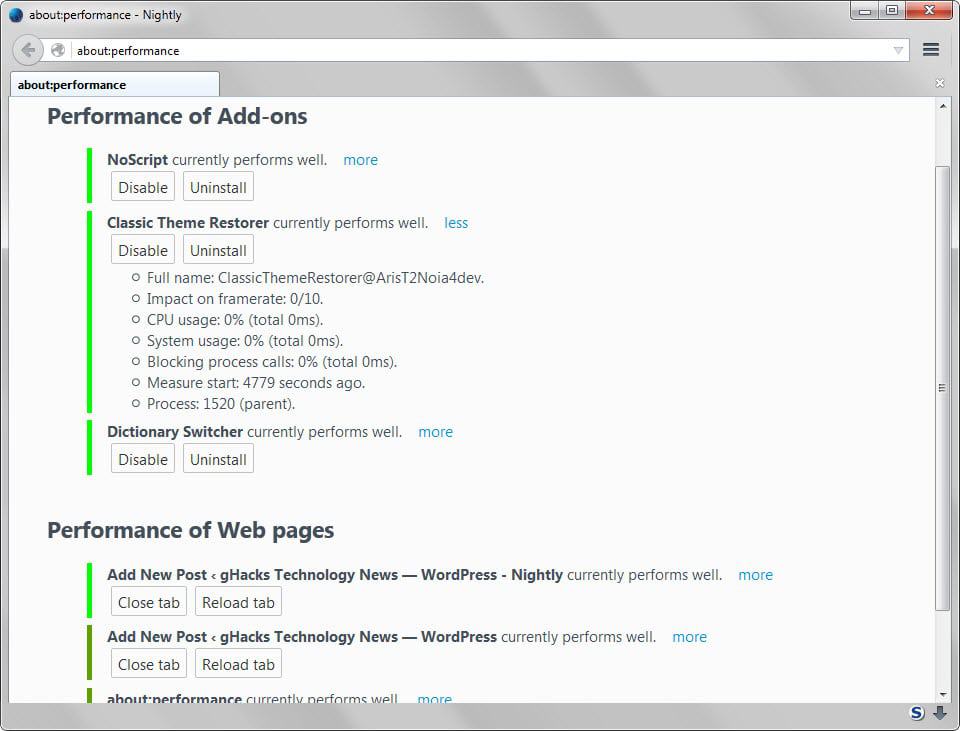
Mozilla introduced the Performance Monitor in Firefox Nightly about three months ago. The new internal page of Firefox listed performance related data for all installed add-ons and open websites.
While that was useful to find misbehaving add-ons or sites quickly, the way that data was presented was far from ideal.
Probably the biggest issue was the terminology that Mozilla used on the page, and then to a lesser degree how the data was displayed on it.
Terminology like jank level or cross-process made interpretation of the data difficult as the page was missing descriptions or information on how to interpret the values.
The redesigned page makes things a lot easier as it is now clear on first sight if add-ons or open web pages impact performance of the browser.
The color bar on the left next to each add-on and web page is the first indicator. If it is green, light green especially, then it is performing fine. If it turns dark green or to another color such as red, it is not performing that well anymore.
Text next to each add-on and web page indicates the status as well. If it reads "currently performs well", all is good meaning the performance impact of the add-on or page is not impacting overall performance.
A click on the more link lists detailed information that include cpu and system usage, the blocking process calls percentage, or the impact on the framerate.
Only the last 10 seconds are processed by default on the about:performance page. While you cannot set the value to a different one, you may disable it so that all session data is included instead.
This can be useful if you want complete session data which should paint a clearer picture on performance issues. The main reason for this is that add-ons or websites may require more performance at times but not all the time.
Buttons are displayed next to each add-on and web page that give you control over their state. Add-ons may be disabled or uninstalled for instance while tabs may be reloaded or closed.
You will notice that information are still amiss on the page. Plugins or userscripts are not listed for example right now. Since both can impact performance significantly as well, it would make sense to add those to the page to provide a full picture. (via Sören Hentzschel)




There is an extension for easy access of performance report,
https://addons.mozilla.org/en-US/firefox/addon/performance-reporter/