How To Add Information To The Windows Task Manager
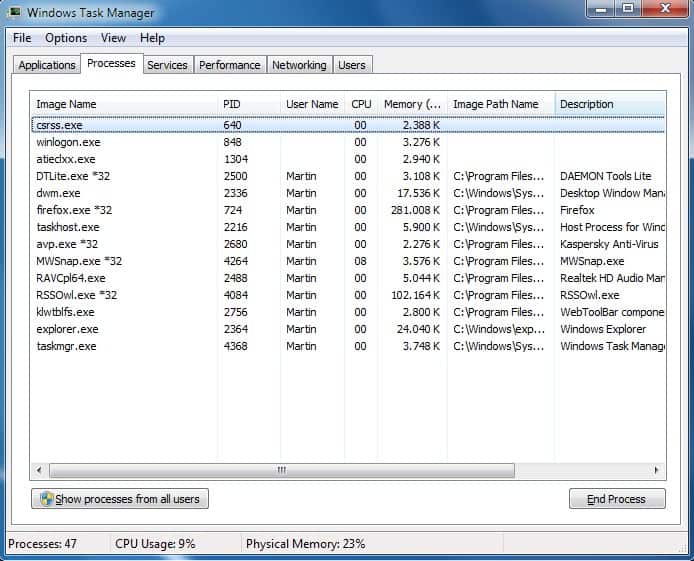
The Windows Task Manager provides information about the current state of the operating system. It can display running processes, applications, services, PC performance graphs, network adapters and connected user. In newer versions of Windows, you may also get the app usage history or startup listings.
Although the Task manager does not display as many information as advanced third party tools such as Process Explorer, it is usually sufficient for basic tasks and a first overview of what is running on the computer system.
Many Windows users do not know that it is possible to display additional information in the Windows Task Manager. The following guide gives an overview on how to enable the display of additional information in the Windows Task Manager.
Loading the Windows Task Manager
The keyboard shortcut to load the Windows Task Manager is [Ctrl][Shift][Esc]. The task manager can also be loaded by right-clicking the Windows Taskbar and selecting (Start) Task Manager from the menu.
Windows Processes
Although it is not the left-most tab on older versions of Windows, the Processes tab is the default tab activated when opening the Task Manager.
The Processes tab provides detailed information on running processes, such as CPU and memory usage, PID and user rights, and in newer Windows versions includes a short human-readable description of the process.
The listing is filtered by default, and you may need to click on the button labelled "Show processes from all users" will display all running processes.
Update: On newer versions of Windows, you may want to switch to the details tab for more information. Also, right-click on the column header to add new columns instead of selecting the option listed in the next paragraph.
A click on View > Select Columns opens a configuration menu to add columns to the display. Most of the additional information that can be enabled in this menu is intended for developers and administrators, but end users may find it helpful as well.
For instance, it is possible to display the path of running processes, which can be very helpful to identify the program that has started the process.
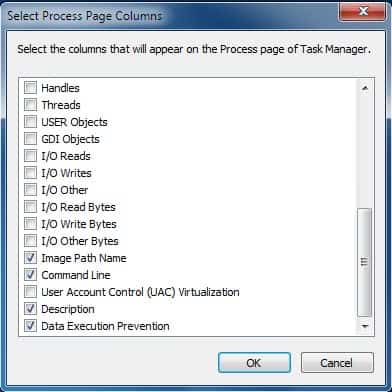
The Memory Peak Working Set column is another interesting data bit that can be enabled. It displays the maximum amount of computer memory of each process in the task manager. The configuration menu can also be used to remove columns from the display in case they are not needed or used. A recommended setting is to keep all columns that are activated by default and add the Image Path Name and Memory - Peak Working Set columns.
Networking
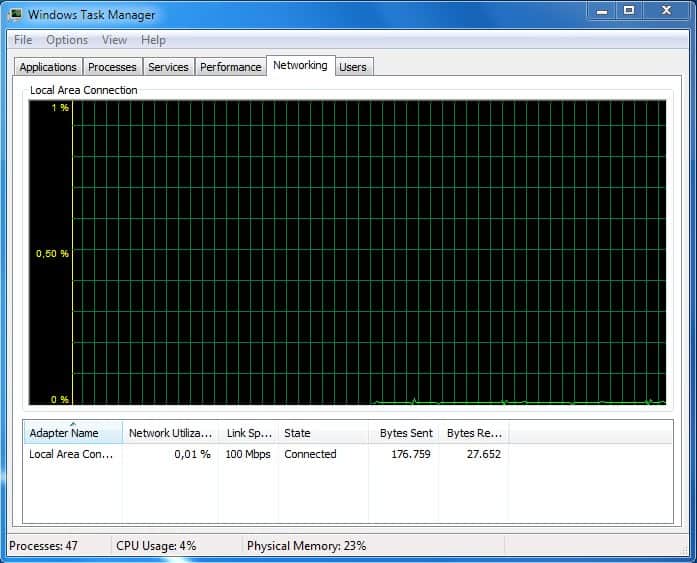
The Networking tab displays information about each network adapter. Most Windows users will not see much there when they open the tab in the Windows Task Manager.
Like the Processes tab, the Networking tab can be configured to display additional information by clicking on View > Select Columns.
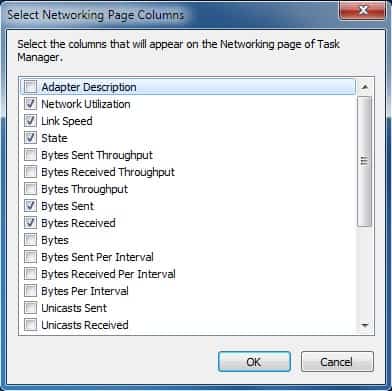
In addition to the total amount of data transfer, separate graphs representing Bytes Sent and Bytes Received can be enabled. The network traffic will be monitored and displayed once the selections have been made.
Note that networking is no longer displayed in its own tab on Windows 10. You need to click on Performance and select the network adapter from the list of available sources. It is less customizable than the networking display on Windows 7 and older versions of Windows.
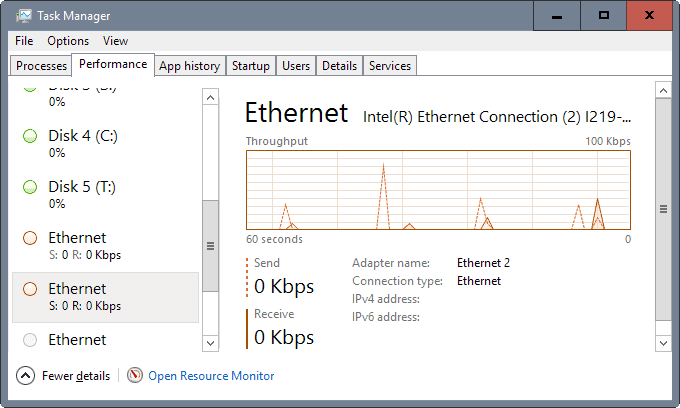
These just two examples of Windows Task Manager tabs that can be configured to display additional information. The rest of the Task Manager can be similarly configured as well. End users will especially benefit from the additional information in the Processes tab. What other Task Manager configuration tips do you have? Let us know in the comments.




Very interesting. Saves using other software to get the same information.