A detailed Windows Resource Monitor guide
The Windows operating system comes with plenty of built-in tools to analyze resource usage. The most prominent one is probably the Windows Task Manager, as it highlights resource usage of individual processes, and gives admins and users options to kill any misbehaving ones.
The Performance Monitor and Resource Monitor are two additional tools that admins and experienced Windows users may use to analyze performance or resources related issues on Windows PCs.
Let's start by taking a look at what the Resource Monitor is, and how it differs from the Windows Task Manager and Performance Monitor.
What is the Resource Monitor?

Microsoft added the Resource Monitor to the company's Windows Vista and Windows Server 2008 operating systems and made it a part of any new Windows version that it released since then. The program displays information about hardware and software resources in real-time.
The Task Manager can best be described as a tool that runs on the surface. It lists processes and services, and general resource usage.
The Resource Monitor, on the other hand, gives you options to look under the surface to look up information that the Task Manager does not provide.
Resource Monitor runs under the Performance Monitor process.
How to start Resource Monitor
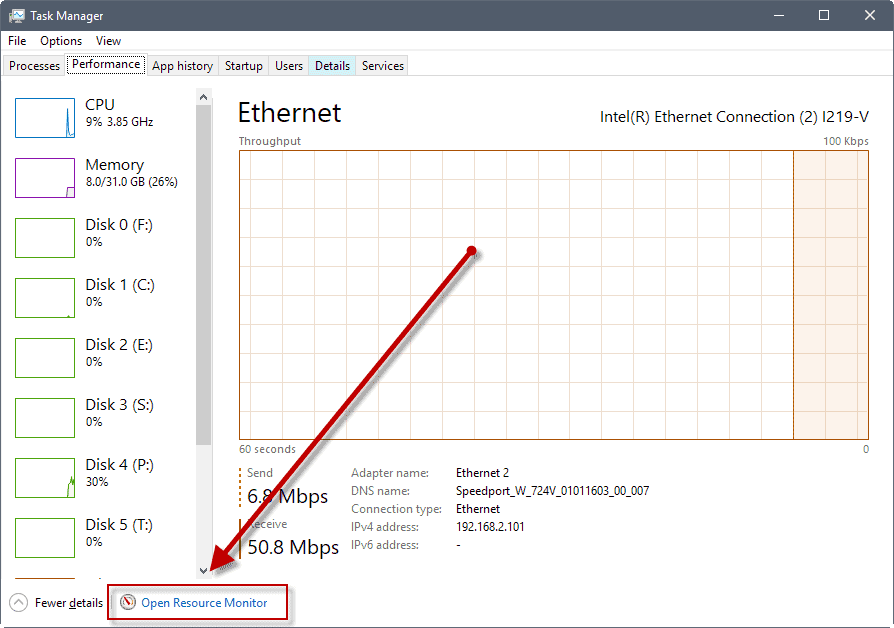
Users and admins have several options to start Resource Monitor. It is included in several versions of Windows, and some options to start the tool are only available in select versions of the operating system.
The first two methods should work on all versions of Windows that are supported by Microsoft.
- Use Windows-R to open the run box. Type resmon.exe, and hit the Enter-key.
- Use Windows-R to open the run box. Type perfmon.exe /res, and hit the Enter-key.
- On Windows 10, select Start > All Apps > Windows Administrative Tools > Resource Monitor.
- On previous versions of Windows, select Start > All Programs > Accessories > System Tools > Resource Monitor.
- Open the Windows Task Manager with Ctrl-Shift-Esc. Switch to the Performance tab, and there on "open Resource Monitor".
The Windows Resource Monitor
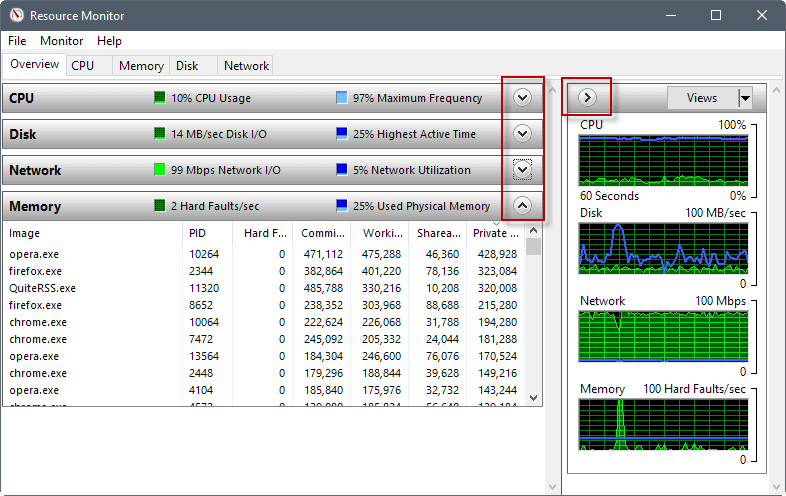
The Resource Monitor interface looks the same on Windows 7, Windows 8.1 and Windows 10. The program uses tabs to separate data. Overview, CPU, Memory, Disk, and Network are the five tabs of the program.
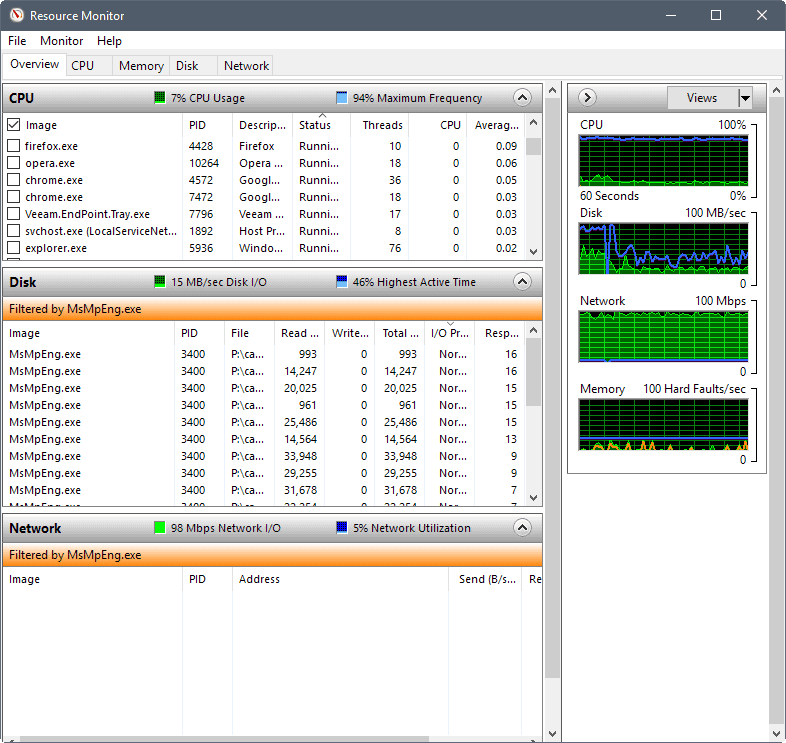
The program loads an overview when you start it. This overview lists CPU, Disk, Network, and Memory data including all processes that use resources.
The sidebar displays graphs that highlight the CPU, Disk, Network, and Memory use over a period of 60 seconds.
You can hide and show elements with a click on the arrow icon in title bars. Another option that you have to customize the interface is to move the mouse cursor over dividers in the interface to drag the visible area. Use it to increase or decrease the visible area of the element.
You may want to hide the graphs, for instance, to make more room for more important data and run the Resource Monitor window in as large of a resolution as possible.
The overview tab is a good starting point, as it gives you an overview of the resource usage. It highlights CPU and memory usage, disk utilization, and network use in real-time.
Each particular listing offers a wealth of information. The CPU box lists process names and IDs, the network box IP addresses and data transfers, the memory box hard faults, and the disk box read and write operations.
One interesting option that you have right here and there is to select one or multiple processes under CPU to apply filters to the Disk, Network and Memory tab.
If you select a particular process under CPU, Resource Monitor lists the disk, network and memory usage of that process only in its interface. This is one of the differences to the Task Manager, as you cannot do something like that in the tool.
Monitor CPU Usage with Resource Monitor
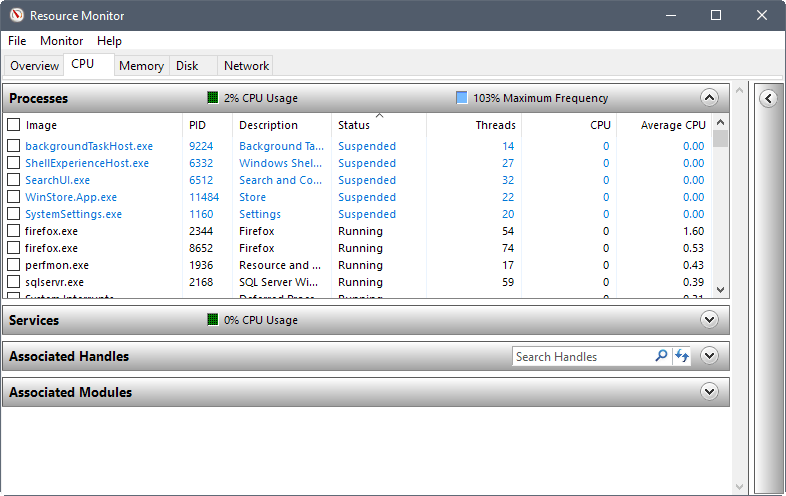
You need to switch to the CPU tab if you want to monitor CPU utilization in detail. You find the processes listing of the overview page there, and also the three new listings Services, Associated Handles and Associated Modules.
You can filter by processes to display data only for those processes. This is quite handy, as it is a quick way to see links between processes, and services and other files on the system.
Note that the graphs are different to the ones displayed before. The graphs on the CPU tab lists the usage of each core, Service CPU usage, and total CPU usage.
Associated Modules lists files such as dynamic link libraries that are used by a process. Associated Handles point to system resources such as files or Registry values. These offer specific information but are useful at times. You can run a search for handles, for instance, to find out why you can't delete a file at that point in time.
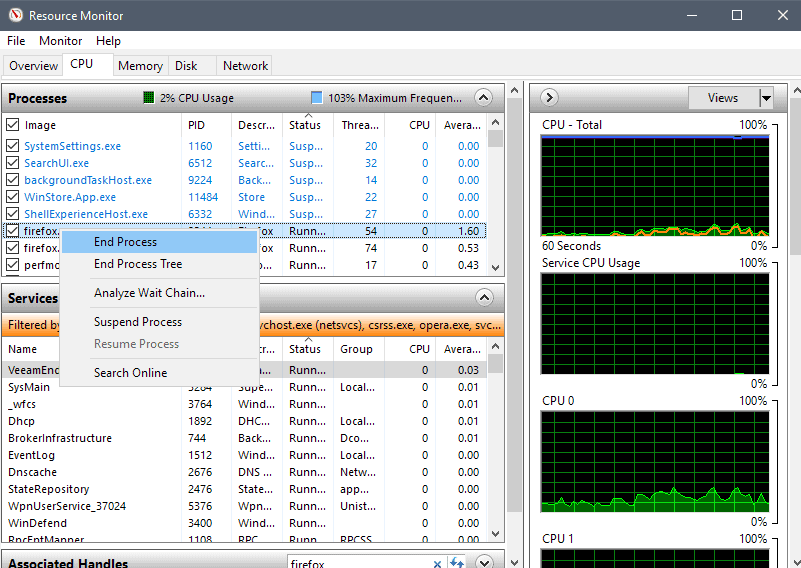
Resource Monitor gives you some control over processes and services on the CPU tab. Right-click on any process to display a context menu with options to end the selected process or entire process tree, to suspend or resume processes, and to run a search online.
The Services context menu is limited to starting, stopping and restarting services, and to search online for information.
Processes may be displayed using colors. A red process indicates that it is not responding, and a blue one that it is suspended.
Memory in Resource Monitor
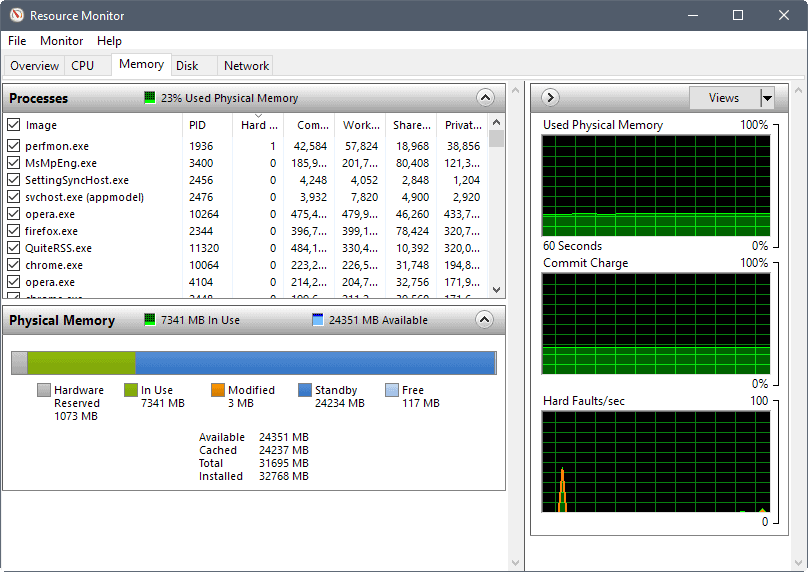
The memory tab lists processes just like the CPU tab does, but with a focus on memory usage. It features a physical memory view on top of that that visualizes the distribution of memory on the Windows machine.
If this is your first time accessing the information, you may be surprised that quite a bit of memory may be hardware reserved.
The graphs highlight the used physical memory, the commit charge, and the hard faults per second.
Each process is listed with its name and process ID, the hard faults, and various memory related information.
- Commit -- Amount of virtual memory reserved by the operating system for the process.
- Working Set -- Amount of physical memory currently in use by the process.
- Shareable -- Amount of physical memory in use by the process that can be shared with other processes.
- Private -- Amount of physical memory in use by the process that cannot be used by other processes.
You get the same level of control in the right-click menu so that you can terminate any process using it.
Disk Activity information
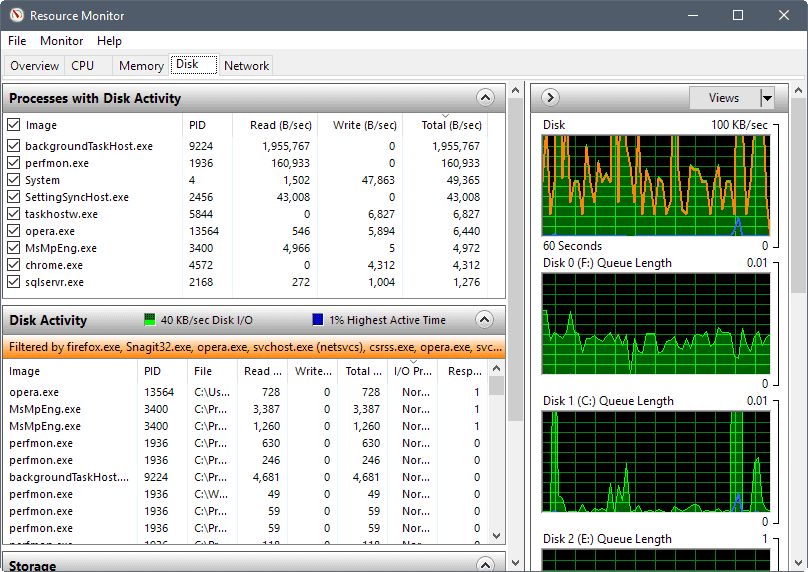
The Disk tab of the Windows Resource Monitor lists the disk activity of processes and storage information.
It visualizes the disk usage in total and for each running process. You get a reading of each processes' disk read and write activity, and can use the filtering options to filter by a particular process or several processes.
The Storage listing at the bottom lists all available drives, the available and total space on the drive, as well as the active time.
The graphs visualize the disk queue length. It is an indicator for requests of that particular disk and is a good indicator to find out if disk performance cannot keep up with I/O operations.
Network Activity in Resource Monitor
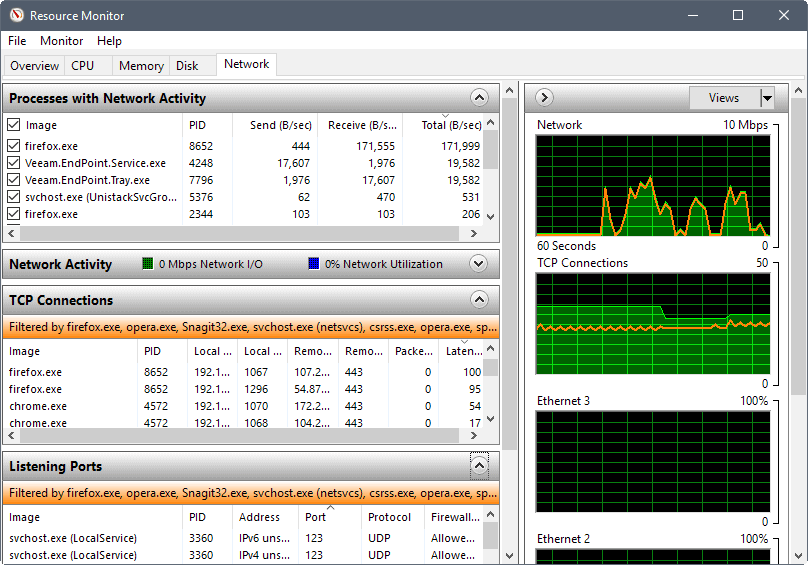
The Network tab lists network activity, TCP connections and listening ports. It lists network activity of any running process in detail. This alone is useful, as it tells you right away if processes connect to the Internet.
You do get TCP connection listings that highlight remote servers that processes connect to, the bandwidth use, and the local listening ports.
Things you can use Resource Monitor for
- Check Hard Faults, and used Physical Memory to find out if your PC needs more RAM. Hard Faults happen when data that a process needs is pulled from disk (Page File) and not from memory. Physical Memory is straightforward, as it highlights how much of the available RAM is in use.
- Use the CPU tab to associate processes with Windows Services.
- Find out which programs write to disk at a specific point in time.
- List all outbound connections of the PC, or find out if a process connects to the Internet.
- Check all listening ports, and close those that you don't require.
Resource Monitor Tips:
- You can stop the monitoring at any time with a click on Monitor > Stop Monitoring. This blocks the auto-refreshing of the data.
- Move the cursor over a heading to display a description.
- Right-click on the header row of a listing and pick "select columns" to add or remove columns from the table. You can add platform or elevated information to the processes listing this way for example.
- Click on any column header to sort the table accordingly. A click on processes for example sorts by process name.
- You can save configurations and load them again using the File menu.
Closing words
Resource Monitor is a handy program for system administrators, experienced users, and even for regular users. It offers more information than the Task Manager, and gives you some tools at hand to dig a bit deeper when it comes to activity on a Windows machine.
Now You: Do you use the resource monitor?








Agreed, no “detail†on Cycles or Avg Cycles. The lack of an explanation for the all the columns of information displayed in resource manager makes this guide incomplete.
Annoyingly its also the second top search result when you search for “average cycle resource monitor”.
There is no “detail” on Cycles or Avg Cycles
I observed some un-know name (Xiaoqiang) show on the network activity. It under the svchost.exe image. Under this image, it keep send data out. Anyone have any idea about this? How to trace it out?
This is xiaomi router.
I have an app that says I’m sending ~13/14 Mbps and the Task Monitor says it’s ~ 6 Mbps, yet the Resource monitor Network activity says it’s measured in B/sec and says its sending @ ~550,000 B/sec
also in the Graph the max is @ 10 Mbps while the activity is staying around the 5 mark
So I’m assuming the app is using a different measurement and the Task monitor and Network Acitivty graph are correct with th ~5-6 Mbps but what’s with the 550,000 B/sec measurement?
And what measurement would the app be really using when it says 13/14 Mbps?
Hello, does anyone know how to alter the Y axis scale on the graphs? it changes randomly, I don’t really need auto scaling, just being able to set the Y axis (eg, setting it 10Mbps for the network traffic monitor)
I came here to find out what the green and blue parts of the disk usage graph mean, but they are not mentioned.
From looking at the left side, it looks like it’s saying that the blue of the disk activity graph means the highest active time. So, during the one second between updates, the blue line represents the highest level while the green is the average? Something like that? Though, on the left it can say less than 100%; so, what does that mean? yes, this does need a fuller explanation.
What blue and green represent is displayed on the left side, e.g. cpu usage and maximum frequency for CPU.
The per cent shown for CPU Maximum Frequency is not described in detail enough for understanding., Over what time interval is the % Maximum Frequency calculated? Maximum Frequency of what?
Exactly – I can see where the cpu usage is displayed by the green peaks and troughs but the blue for my cpu, disk and memory is really high and non existent on the network graph, I need a dummy’s guide to this monitor!
I highly recommend that you use Process Hacker instead of Process Explorer.
https://processhacker.sourceforge.io/
Thanks. But… Excuse my ignorance. What do you mean by ‘migrate’? Is it possible to migrate the settings so that the migration doesn’t leave me with not much more than a clean installation would? BTW. I recall Acronis True Image allows for copying of individual files from backup images. What a marvelous tool! I usually rely on clonezilla because it’s free but it doesn’t feature many of ATI hyper-conveniences.
You can copy files out of images with Macrium Reflect (which has a free version, somewhat hidden). Mount the image, then browse and copy from it as you would from a disk with Windows Explorer.
Well, all your programs will stil be installed, same as drivers, updates, frameworks and redistributables. Some settings may be reset to their defaults, but most won’t. You can copy Local and Roaming folders found withing your profile folder’s “AppData”; and the entire “My documents” folder so most 3rd party programs will keep your settings. You’ll have to curate them a bit, for instance don’t copy the Temp folder inside “Local” or the “Microsoft” folders inside both Local and Roaming.
Resource Monitor has stopped working on my Windows 7 x64 system recently 8-| Same with the calendar window (double-click on the system clock). I tried:
1. Uninstalling all Windows Updates up to a month back.
2. sfc /scannow ; no problems found
3. perfmon /res and perfmon /sys from command prompt with administrative rights ; neither starts the resource monitor nor returns any messages
Any ideas?
Try creating a new user. If it works migrate everything from your old one. Also you can try a scan with malwarebytes antimalware (free). But if the first method does not work, I suggest a reinstall of your OS.
What the f*ck. It’s the same interface as Comodo KillSwitch and that can runs even on Xp. Microsoft has stolen this from Comodo because Comodo has this for many years and you can download this for free.
Resource Monitor is a necessary complement to Task Manager, which is too limited (Windows 7 here). For instance, only Resource Monitor will show what discs are currently spinning.
However, its interface is desperately stupid and incoherent with other parts of Windows, as so many things in this wretched operating system. Those weird stacked panels ! Those nested scrolling bars ! Those non width-adjusted columns ! I wish we had a single tool merging Task Manager and Resource Manager, with a summary view and an extended view, instead of having to juggle with two pieces of software, none of which is satisfactory.
Also, help should be available everywhere in those tools. It’s not enough saying : “Here are the zboong-thing figures in that column”. I expect Microsoft to put a pop-up there, or something equivalent, explaining what exactly is the zboong-thing, why on earth we should be interested to check it, and what type of zboong we should be looking for in what instances.
Plenty of individual developers of monitoring tools do just that, out of their mommy’s basement so to speak. Why is it mighty Microsoft can’t pull it off ?
Process Explorer is the tool you seek. And the interface is that way because it’s inherited from Windows 2000. All the MMC snapins are that way, Resource Monitor is actually one of the better looking.
Check out all the Sysinternals tools, which they for some reason host under a “docs” subdomain: https://docs.microsoft.com/en-us/sysinternals/
Thank you, but that’s not really what I had in mind. I know and use Process Explorer and other Sysinternal programs. Their interface is logical and consistent. The head developer is a Microsoft rock star. However, Process Explorer and other Sysinternals are more advanced tools. They are really more about trouble-shooting. They often require some really deep know-how.
:D Exactly.
While I am logged on…Task Manager and resource monitor run simultaneously on my task-bar. In addition I like to monitor the amount of bandwidth supplied while using the network.
I like to stream my favorite teams games and or movies / TV shows etc ..if I forget…and have been logged onto my favorite browser for an extended period of time, it can affect my stream, I access the resource monitor and can clearly see via the network tab, a tremendous amount of data being sent. While observing via RM, I truncate the stream by ending the task of the browser, but data is still being sent while the browser is grayed out…if I disconnect WiFi…then my system intervenes and stores the data to be sent later…and of course, you can’t end the task of the system .
I’m not paranoid, and It just might be that the system if sending performance data to my system events module but between the system, the browsers, various applications that are running. There seems to be a lot going on. But…I will say this…
It is cool that Microsoft included decent task and resource monitoring in Windows.