Web Browser Memory Usage Benchmark Gets It All Wrong
Web browser memory usage might not be that much of an issue in these days with Gigabytes of computer memory being build into modern computer systems. There is however the low end market that is fueled by the success of netbooks and other low end hardware. A memory usage test of popular web browser might therefor not affect all computer users but it could be interesting for those that run low end hardware or want to make sure they to use an efficient web browser.
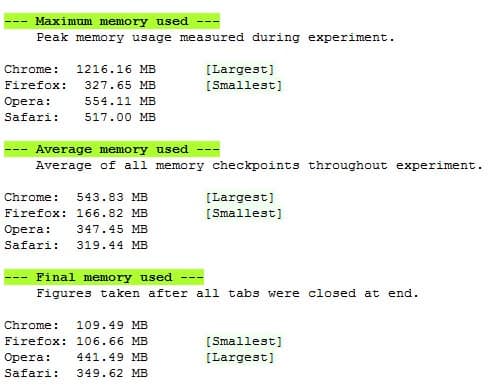
A web browser memory usage comparison was recently posted a the Dot Net Pearls website that compared the memory usage of the Google browser Google Chrome, Mozilla Firefox, Opera 10 and Safari. The web browsers were configured to open 30 tabs over the command line which where then closed manually by the author except for one. A script running in the background recorded the memory usage of all processes during that time which were then used in the comparison.
The results of the web browser memory usage benchmark were then divided into three chars displaying the maximum, average and final memory used by each of the tested web browsers. The Mozilla Firefox web browser used the lowest amount of computer memory of all tested web browsers while the Google Chrome browser showed very high maximum and average memory usage.
And here is where the tester got it wrong. To compute the memory usage all processes where taken into consideration which effectively meant double-counting the shared memory for each process. As the Chromium blog points out:
If you're measuring memory in a multi-process application like Google Chrome, don't forget to take into account shared memory. If you add the size of each process via the Windows XP task manager, you'll be double counting the shared memory for each process. If there are a large number of processes, double-counting can account for 30-40% extra memory size.
To make it easy to summarize multi-process memory usage, Google Chrome provides the "about:memory" page which includes a detailed breakdown of Google Chrome's memory usage and also provides basic comparisons to other browsers that are running.
Google Chrome's result would still be higher than that of Firefox even after the adjustments but this is one of the trade-offs of a multi-process browser (which Google Chrome is). You would get the same result with Microsoft's Internet Explorer 8 if the tester would have tested that web browser as well. This was apparently not possible due to technical difficulties.
Another aspect that needs to be mentioned is the test result of the Opera web browser. Opera is using an automatic setting called Automatic RAM Cache that is enabled by default. This allocated about 10% of the computer memory by default and should be disabled in memory benchmarks. Opera would most likely still have been beaten by Firefox but the gap would probably have been lower.
Advertisement










In Firefox too, Automatic RAM Cache is enabled by default.
Also, note the tests were done in Vista, yet Google cites Window XP. Why would they make such an obvious mistake?
FUD by Google. To quote http://news.ycombinator.com/user?id=barrkel
“He is using Process.PrivateMemorySize64 in .NET. It doesn’t double-count, because it only counts non-shared pages.
Non-shared working set pages are probably the most relevant measure, as a process-per-tab model will have lots of address space and may use memory mapping extensively, and so have lots of non-shared pages, but not actually touch many of those pages, and end up with a relatively small working set. However, .NET’s Process class doesn’t have an equivalent property to Process Explorer’s “WS Private” column.
EDIT: Sure enough, a quick eyeball of some Chrome subprocesses using Process Explorer gives me these results:
Private WS Private
1416 460
14916 7952
12084 9780
16780 13972
16164 11336
14812 12040
10284 4444
19140 15400
All numbers in KB. Non-shared working set impact on an unloaded machine, probably the most important measure for Windows, is usually quite a bit less than the private bytes.”
Spot on with Opera automatic settings! Turns out it uses extremely agressive memory cache by default – that’s why high figures.
Got me interested and I did my own test to compare:
http://www.rarst.net/software/browser-memory-benchmark/
Biggest thing these test get wrong that there is different memory consumption.
1. Memory usage.
2. Memory leaks.
Memory usage is desirable. Memory is very very fast, it makes sense to make use of this resource. As noted in post Opera may reserve good chunk of memory just to have it ready.
Memory leaks are harmful. This is memory wasted because it was used but forgotten (and thus locked from further usage) afterwards.
Memory test can’t tell a difference between to so they make no sense. Except maybe generating buzz for publisher and marketing leverage for browsers.