Sidebar Diagnostics is an open-source application that displays hardware information on your desktop
Do you want a resource friendly program to keep an eye on your computer's hardware? You should give Sidebar Diagnostics a try.
It is a free and open source application that is compatible with all supported versions of Windows provided that the Microsoft .NET Framework 4.7.1 is installed.
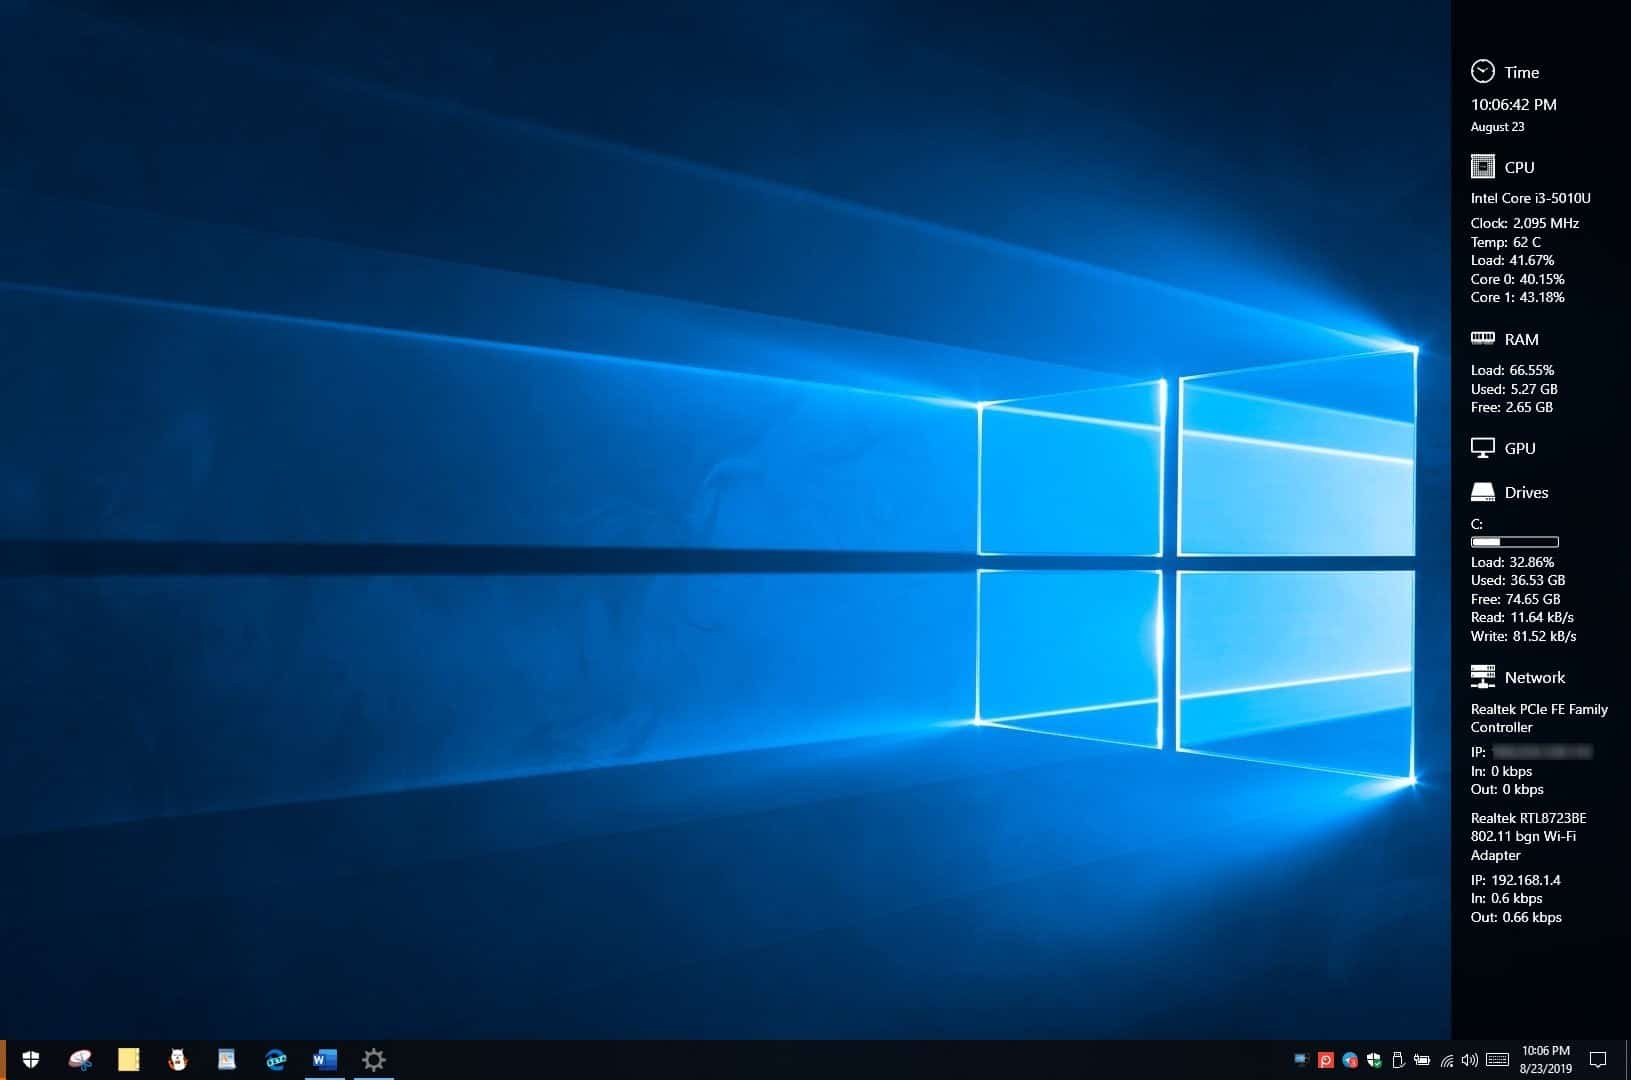
When you install the program, it adds a side-bar to the right side of the screen that displays data from five core hardware monitoring tools: CPU, RAM, GPU, Drives and Network.
The sidebar display ensures that the readings are available at all times on the desktop. If you prefer a standalone program with its own window, check out alternatives such as HwInfo, Windows Resource Monitor, or SpeedFan (for controlling temperatures).

The program displays details for each of these monitors, e.g. the CPU's core clock speed, temperature, load (in %). Likewise the RAM monitor displays the amount of used memory and free memory. The Drives group has a bar that indicates the amount of used storage, and so on. There is also a clock on the top of the sidebar which displays time and date.
Move the mouse over the sidebar and you will see three icons at the top of the screen: Graph, Settings and Exit. Click on the graph to view a visual representation of the hardware information from any of the five mentioned monitors based on a selected time-scale. The CPU temperature reading supports values between 15 seconds and 15 minutes.
Let's head over to the settings. This opens in a pop-up window that has five tabs. The General tab allows you to set the side-bar placement (right/left), select the screen where it should be displayed (only for multiple monitor setups), and has options for auto-run at boot. The "always on top" toggle pins the side-bar on the screen; this can be useful if you want to check the hardware temperatures, memory usage, or CPU load while gaming or performing intense tasks.
The advanced tab lets you adjust some UI related options. The customize tab in Sidebar Diagnostics lets you choose the sidebar's width, background color and opacity. You can also set the text alignment, font size, font color here. This pane has the option to disable/enable the clock, and set the date format. In case of high usage levels, the program will blink and display the text in red to get your attention.
The monitors tab is the most useful one in the application. You can enable or disable each monitor from this screen. Now it may not seem obvious at first glance, but each of these monitors is customizable. To do so, mouse over one of the monitor's name and left-click on it. This lets you choose the settings for the selected monitor.
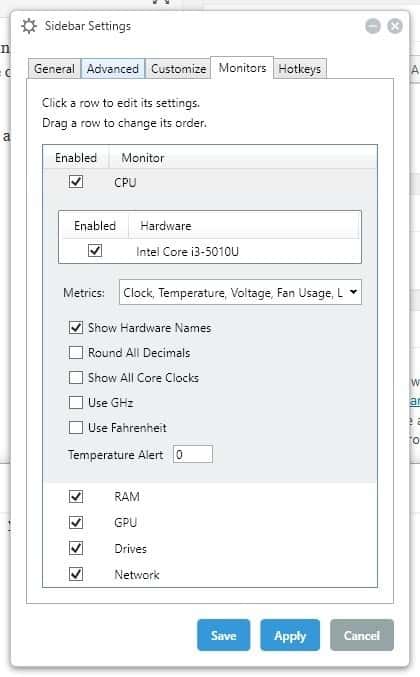
- CPU - Clock, Temperature, Voltage, Fan Usage, Load, Core Load
- RAM - Clock, Voltage, Load, Used, Free
- GPU - Core Clock, CRAM Clock, Core Load, VRAM Load, Voltage, Temperature, Fan Usage
- Drives - Load Bar, Load, Used, Free, Read Rate, Write Rate
- Network - IP Address, Bandwidth In, Bandwidth Out
You can set the CPU and GPU to use GHz and/or Fahrenheit instead of MHz and Celsius. The Hotkeys tab lets you bind your own shortcut keys for various functions such as toggling, showing, or hiding the side-bar.
Sidebar Diagnostics uses Open Hardware Monitor for gathering the data. So the limitations of the latter apply to the former as well. Recent versions use Libre Hardware Monitor for Ryzen support.
Note: The interface could get clunky if you have a lot of drives/partitions. Uncheck some options to only see the information that you need. And in case you exit the application and are unable to use applications in full-screen mode, open the Windows Task Manager and restart the "Explorer" process.
Closing Words
Sidebar Diagnostics is a useful specialized application for Windows; it is especially useful to users and computer workers who need the hardware information, e.g. when troubleshooting the system or making sure that the temperature does not rise above certain levels.









I use XMeters. Lightweight, totally configurable for $5, and sits nicely in your Windows taskbar.
Hi,
the latest version v3.5.3 “now uses Libre Hardware Monitor instead of Open Hardware Monitor for Ryzen support.”
So you might want to update your article.
Nice tool btw.
Yet another recommendation to give some unknown entity complete access to your machine by installing their code.
No thanks.
Hello Martin+Ashwin.
Speedfan seems to have been abandoned by the original creator after 4.5.2 (besides, connections to the site almico.com is flagged as insecure by Firefox & Chrome browsers).
– ravi.
Rainmeter FTW!
I had a look at the developer’s GitHub repository, found out this app requires .Net Framework 4.7.1, nevertheless installed it and ran on a Windows’ performance counters issue with a link to the app’s Wiki page which explains how to fix it. Of course the performance counters are disabled here for most of them, I’m the one who did it (with an app called ‘Extensible Counter List), kept only those needed. Windows out of the box has always had by default a myriad of counters, trackers and tutti quanti everywhere, even on Windows 7.
Uninstalled, reset my counters, removed an installed task, checked remaining files and registry leftovers: clean.
I’m not going to open the snakes’ cage for an application which delivers system information I can have within countless, simple applications and Windows Explorer to start with. I don’t recommend ‘Sidebar Diagnostics’ needless to say.
Oops sorry performance counters is also used for the drive monitoring.
Hi developer here, performance counters is only required for the network monitoring. If you disable the network monitoring in the app settings then you won’t need to enable any performance counters.
Thanks Tom, I have added the info to the review.
ok looks nice
except
how do you install it? you’ve gone over how to run it.. but downloading it just gives some MD files, some CS files, couple of XML files.. a readme that gives no information at all and a load of C files.
no executables or instructions at all..
Hi, you need to open the Releases tab on GitHub and download the Setup executable from there. Here is the link: https://github.com/ArcadeRenegade/SidebarDiagnostics/releases
What happened to Martin
He is Martin during the day but turns into Ashwin at night. Somewhat like Dr. Jekyll and Mr. Hyde.
@RogerW, Martin and Ashwin don’t have the same writing style; now that I read both regularly I usually spot Ashwin as the author (when I’ve forgotten as usual to notice it at start), but it’s true that I read Martin Brinmann signed Ghacks articles since many years and one gets used to a rhetoric in the same way as to a voice. You need to be an expert to modify everything of yourself and my opinion is that martin is more concerned by technology than by psychological distortion.
@Tom Hawack That was a joke. I repeat, a JOKE. A j-o-k-e, get it?
For your further information;
https://en.wiktionary.org/wiki/joke
P.S.You really must be fun at parties.
@RogerW : https://en.wikipedia.org/wiki/Ambiguity
Do you happen to be the only one laughing at your jokes? :=)
@Dear RodgerW
A sense of humor is good for you. Have you ever heard of a laughing hyena with heart burn?
~Bob Hope
I see you have met our Tom Hawack.
Welcome to Martin’s site
Still here. Had a lovely pony riding experience with my daughter and wife over the weekend ;)
Horses are fun, my daughter’s an Eventer, her sport horse, Sally, is a sweetie.