QVGE is an open source graph creation program for Windows and Linux
If you want to analyze statistics, a good way to do this is by writing down the details. When you want to compare the performance of something over a long-term, it is better to use some sort of visual representation like charts, diagrams or graphs.

Now if graphs are your thing, you will find QVGE useful. It is an open source graph creation program for Windows and Linux.
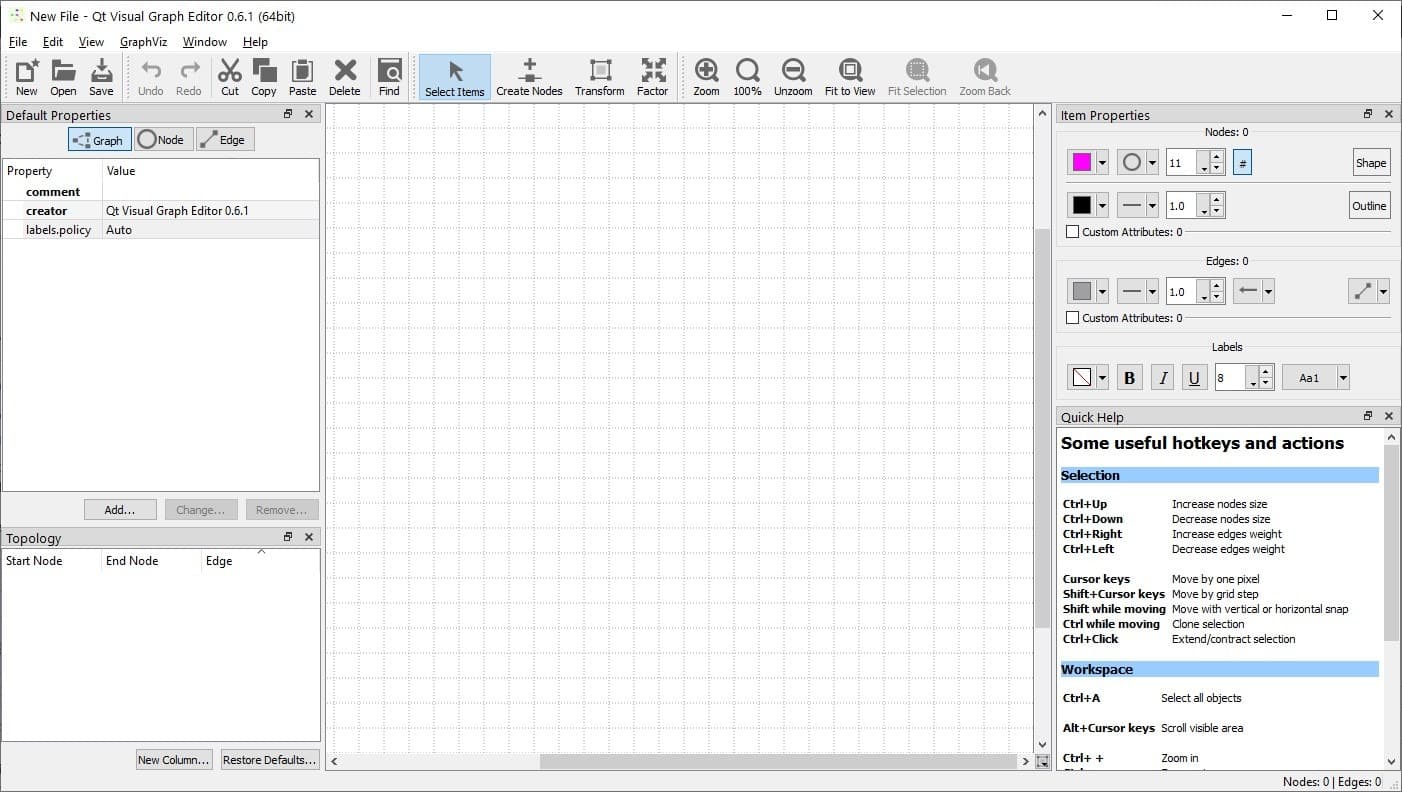
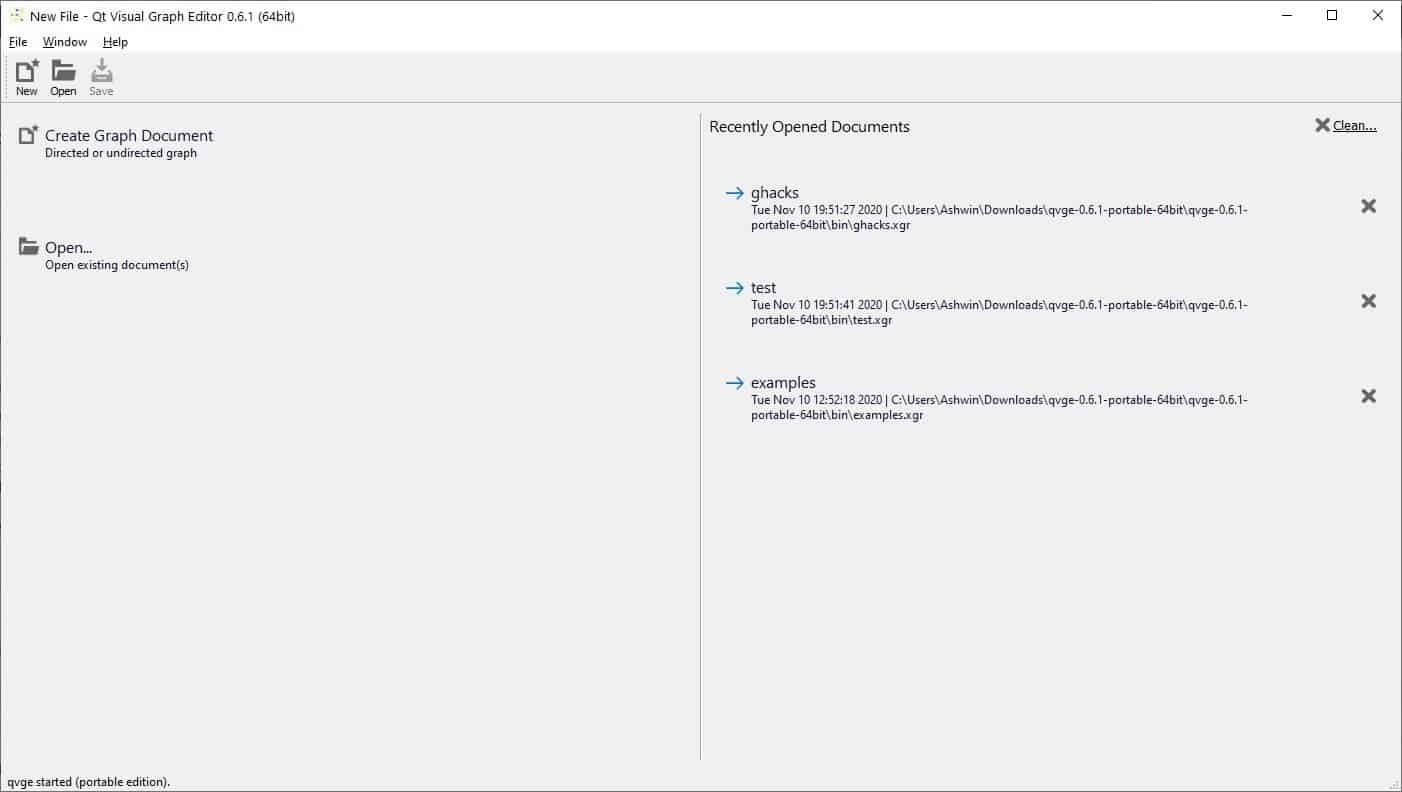
The program's start page lets you save and load documents. Since we don't have any on the first run, click on "Create Graph Document". This opens up QVGE's interface. It has a lot of options, I'll walk you through the details.
The large pane in the center is the grid that acts as your workspace and this is where you draw the graphs. The toolbar at the top has options to add (or remove) content to the graph. It has several sections of tools, almost like a ribbon interface sans the tabs.
The first thing you want to do is to create a Node (points/vertices), click on the Create Node button in the toolbar and then on an empty space in your graph to add the node. It should appear as a colored circle. To another node click on a different place, or you can click on an existing node and drag in any direction and let go of the mouse. This creates a 2nd node and connects it to the first, the connection between the two is called an Edge.
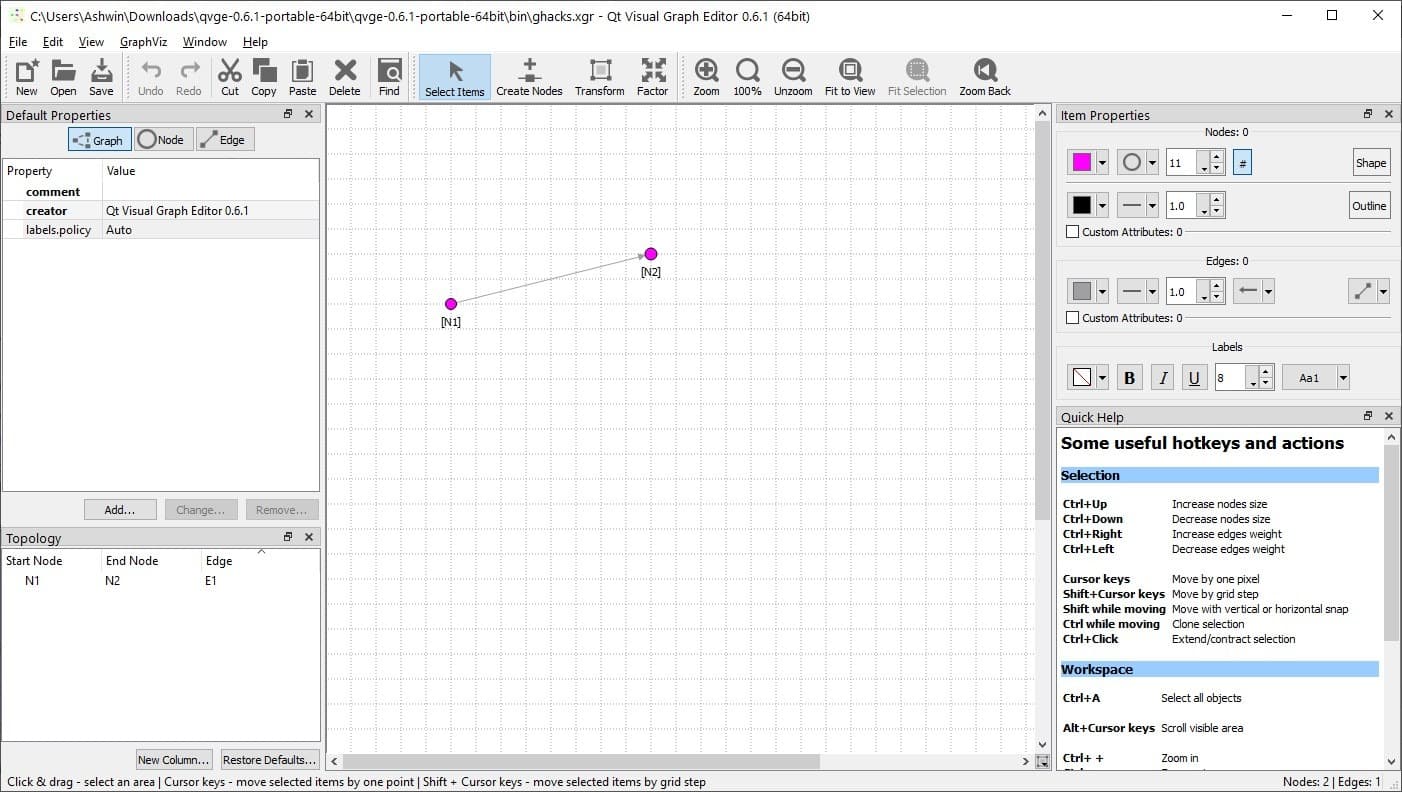
To move a node, click on Select items on the toolbar and drag it to a different place. There are a few ways to customize the nodes, the easy way is to select a node, and use the Item Properties window on the right edge of the screen.
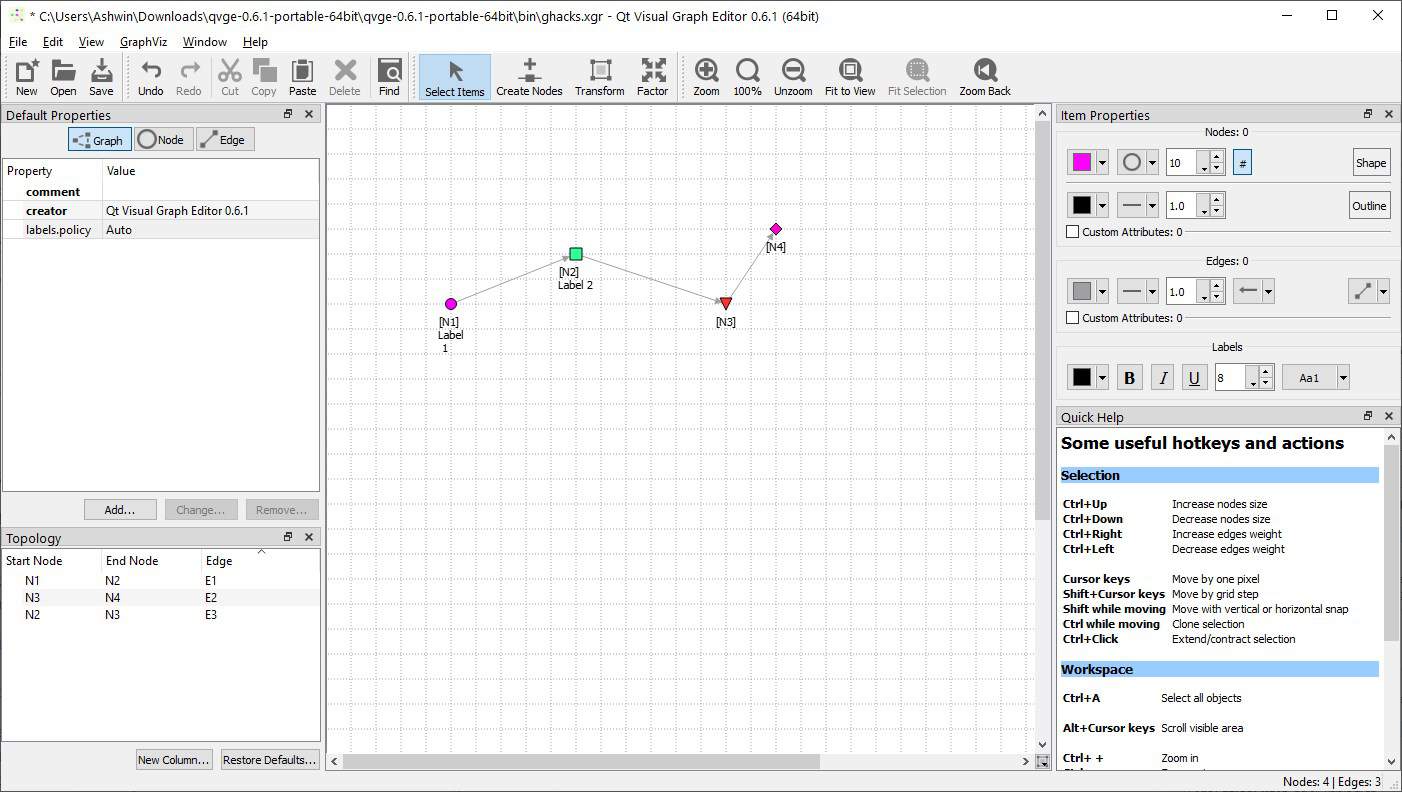
This allows you to change the shape of the node (Disk, Square, Triangle Up or Down, Diamond, Hexagon). You can modify the node's color and size. Every node has an outline which has its own color, border style and size, all of which can also be customized. Transform is used to select and rearrange the nodes and edges.
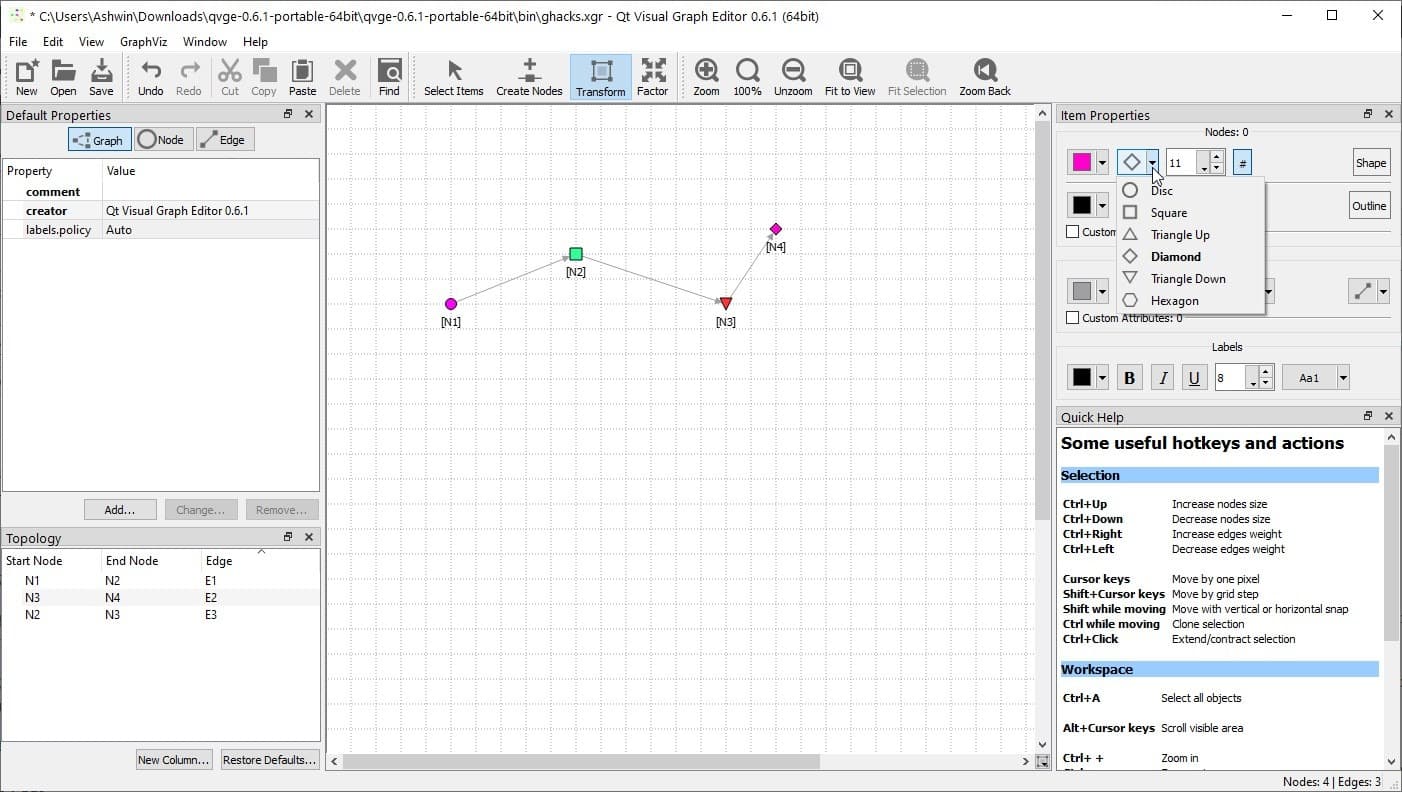
Similarly, you can also customize the color of edges, the line style. Edges can be Directed (one way), Mutual (two-way) or have no ends. Double-click on a node or an edge to add a text label to it, you can customize the text's size, color, and also make them Bold, Italics or Underlined. There are more customization options available in the Default properties window that's on the left side of the screen.
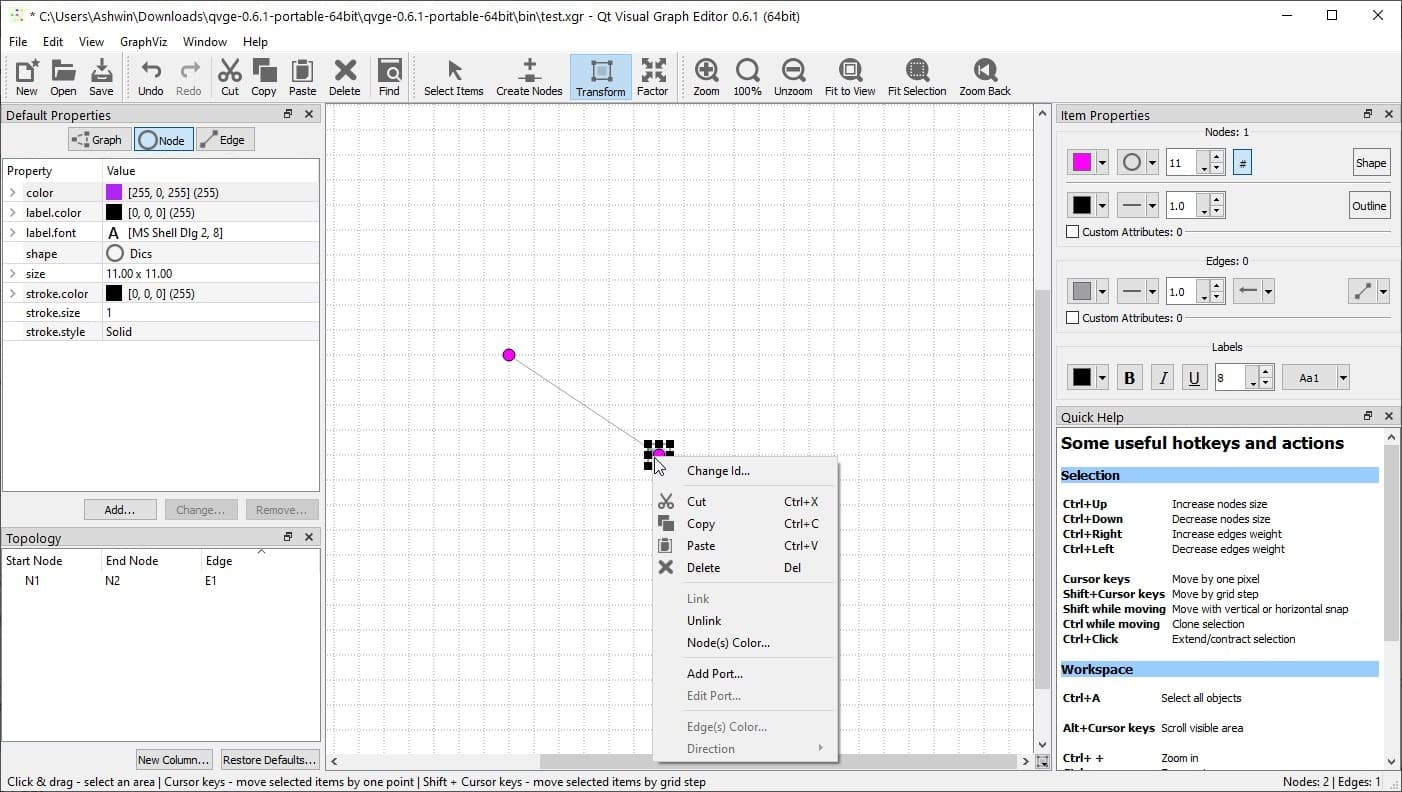
The topology window in the bottom left corner, is kind of like a map or a map legend, it lists each and every node and edge that's available in your graph. Click on an element in the topology to select it in the graph.
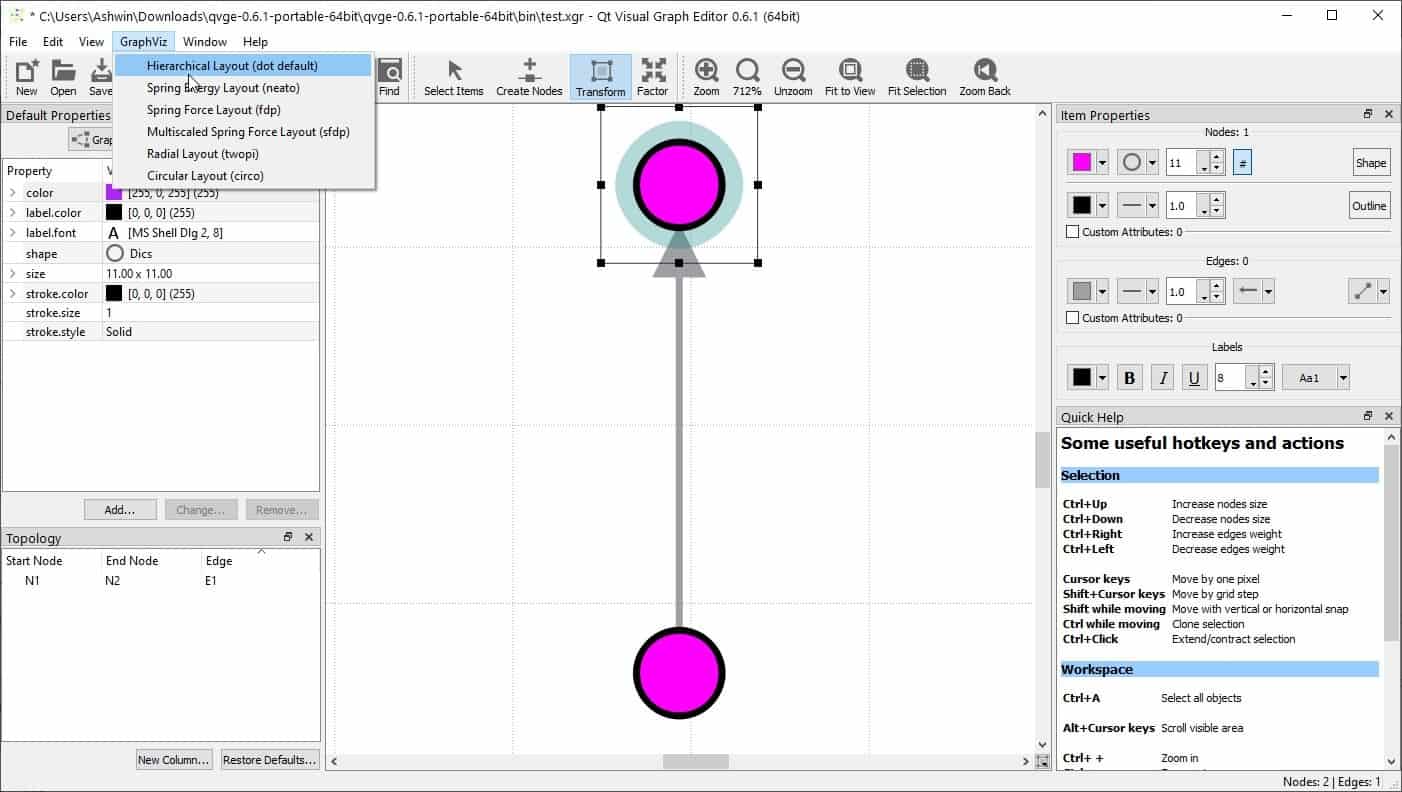
QVGE can save graphs in the following formats: XGR, GraphML, Dot and GV (Graphviz). Speaking of which, there are 5 layouts that you can choose from the GraphViz menu: Hierarchical (dot), Spring Energy (neato), Spring Force (fdp), Multiscale (sfdp), Radial (twopi), Circular (circo).
The Edit Menu has some basic options like undo, redo, cut, copy, paste, etc. It also lets you change the color palette, the Options window is useful for customizing the grid settings. Toggle the grid, snap to grid, display the node and edge IDs, from the view menu. You can also disable any of the panels on the side and the toolbar.
QVGE is written in C++ and Qt. You can find the binaries for Linux as well the installers and portable versions for Windows on the official GitHub page.











That’s good app… Runs smoothly, allows to drag nodes and change custom attrs… Not much apps can do this.
And graphviz integration is brilliant. Thank you!!
This is to draw and auto layout the graphs
Well you can either import a graph from a file or create one by hand.. just like with any vector editor.
Is this a drawing tool rather than a graphing tool? If it doesn’t link to a data table how can it be used to “analyze statistics”?
Do you have to manually calculate the data points then manually ‘draw’ each point on the graphic?
That sounds incredibly tedious.
This looks quite interesting, however I don’t understand the concept. Waht do you feed into it ? What is supposed to come out of it ?