Create Better Looking Excel Charts With Clean Charts
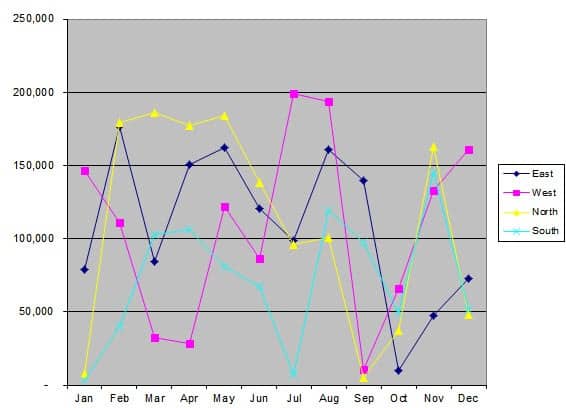
Clean Charts is a lightweight add-in for Microsoft Excel that can improve Excel charts in numerous ways. It addresses several know issues like hard to read labels, scaling issues, font size and color contrast issues.
Note: Clean Charts should work with any 32-bit copy of Microsoft Office but the add-in won't work with 64-bit versions. Whether you need Clean Charts in recent versions of Excel is debatable as Microsoft improved Excel's chart creation capabilities significantly.
Clean Charts
Clean Charts is installed by running the Clean Charts Installer.xls file after unpacking the content of the downloaded archive to a local directory.
Excel users need to make sure that macros are turned on which can be done with a click in Excel 2010 and newer; the app displays a notification at the top that reveals that content has been blocked and that users may enable it.
Users of previous versions of Excel need to go to Tools > Macro > Security and select medium security level (or lower) to allow the execution of macros.
The template displays options to install Clean Charts as an add-in, uninstall a previously installed version of the add-in or try Clean Charts on the active worksheet to test it without installing it.
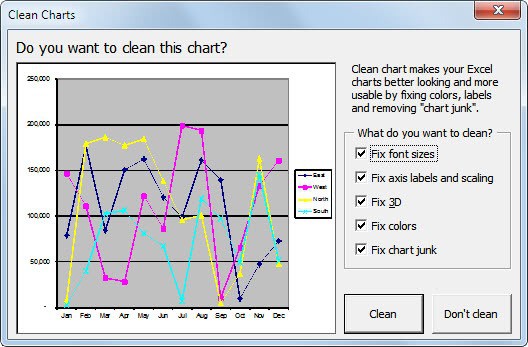
Clean Charts displays an options window whenever it is activated from within Excel. All cleaning options are automatically selected with the option to remove those that are not needed or wanted.
- Fix font sizes
- Fix axis labels and scaling
- Fix 3D
- Fix colors
- Fix chart junk
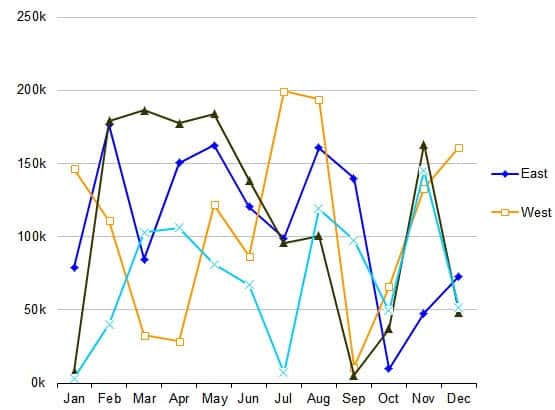
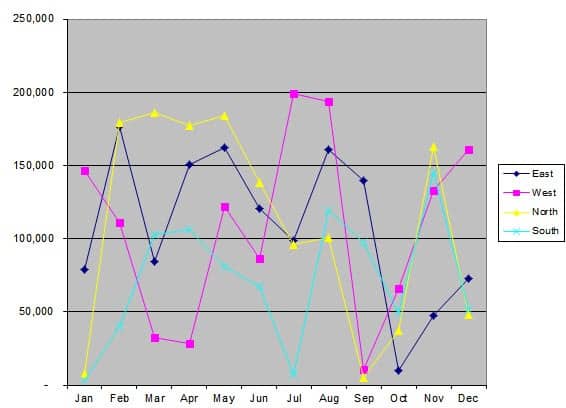
Take a look at the chart before and after optimization below.
The result is a cleaner, professional looking chart. The Excel add-in is added either to the Format menu or the Add-Ins menu if Excel 2010 is used. It offers options to clean all charts that are open or only a specific chart that is displayed on the screen.
Clean Charts can turn unprofessional looking Excel charts into professional ones. Its batch mode, which allows the conversion of multiple charts at once, ensures that the conversion does not need to become a tedious process.
The Excel add-in sometimes has difficulties processing complex charts. It is a good idea to have a backup copy of a document ready just in case even though the undo function should be enough to return to the old chart view if something did not turn out right.
Clean Charts is compatible with Excel 2010, 2007 and 2003 according to the developer. It can be downloaded from the developer website. The Excel add-on displays an error message when installed under Excel 2010. It does however install just fine in the add-ins directory.















all of this stuff can be done from the formatting menus already available, it just takes a little bit time to get used to where things are
Thanks for this – it looks very nice. However, if you compare the ‘before’ and ‘after’ charts, where have ‘North’ and ‘South’ disappeared to (in the legend on the right hand side)?