Filtration Task Manager is a freeware process manager that reports disk read, write and transfer stats in real-time
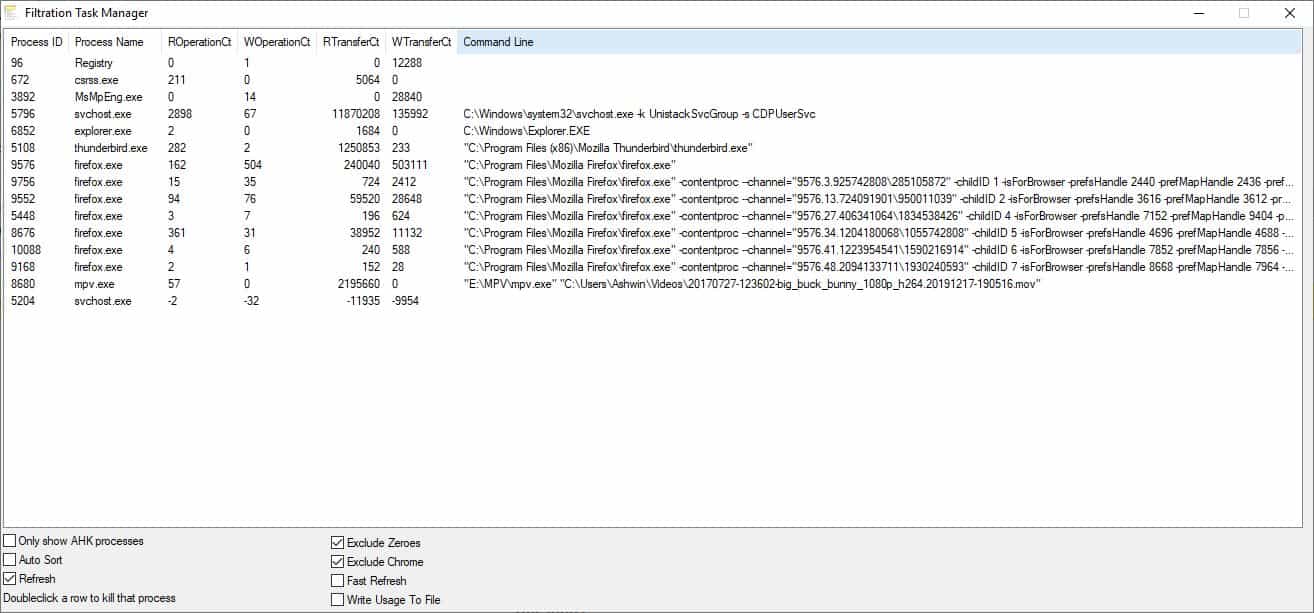
SSD-LED can be used to monitor the usage of a selected drive in real-time, but it doesn't give you the advanced details. If you want a breakdown of the usage on a per-application-basis, give Filtration Task Manager a try.

It is a new freeware application which was among the DonationCoder NANY 2020 Software releases.
Saving the content you are working on, loading new documents, opening new tabs, starting new applications, videos, and other activity will obviously cause a load on the disk and memory which sometimes may be noticeable. Â In such cases, give it a few seconds and your computer should be running like before unless you started an app or task that is very resource heavy or with flaws.
It may be difficult to narrow down lag spikes that are caused by disk usage (background applications) if they occur randomly; that's what this program will help you with.
There are seven columns in the application's interface: Process ID, Process Name, ROperationCt, WOperationCt, RTransferCt, WTransferCt, and Command Line. So, it's like Windows Task Manager? Yes, and no. The difference here is that unlike Microsoft's tool which just displays the stats in terms of percentage and Bytes (Processes and Details tabs), Filtration Task Manager displays the Read, Write, Operation Count and Transfer Count. It gives you a much better idea about how much data is being read and written by an application.
The pre-enabled option, Auto Sort, lists the processes based on the highest load; it seems to me that it is fluctuating between one of the four depending on the highest usage. Since it was refreshing constantly, it was a bit difficult to read the stats. Disabling auto sort offers a better way to monitor a particular process' usage as it allows you to manually sort the list by clicking on the column name.
Speaking of which, when you run the program the task manager interface will not display any process. Hit the "Only show AHK Processes" option on the bottom (that filters out AutoHotKey scripts), to display all applications. Now you'll be able to see every running process and its usage stats. The program tends to refresh too often by default; to reduce this, you can disable the "Fast Refresh" option. You'll need to repeat both steps every time you start the application because it is a portable application and does not save its settings.
Double-click on a process to kill it -- it doesn't warn you though -- so you may have to be careful not to do it accidentally. You can disable the "Refresh" option, but doing so stops the real-time monitor, which makes using the application kind of moot.
"The Exclude Chrome" option is useful for Google Chrome users, as the setting hides the browser's processes. This is to avoid the list from being cluttered, as Chrome opens each tab in its own process. Sadly, there is no such option available for Firefox. The developer has mentioned improving the program with more features such as support for RegEx or Custom File Output Path.
Closing Words
This isn't the sort of application you'd use everyday, it's one that you may only want to fire up when you experience some sluggishness in the computer's performance. I mostly used it to see how different programs were behaving, and learn which ones aren't worth keeping in the background. You could of course customize Task Manager's Details tab to include the I/O read, write and other stats, but then you don't get the filters that are offered by Filtration Task Manager (AutoHotKey, Chrome). Maybe we will get more options in the future?








Resource Manager (from the Task Manager) does a pretty good job.
Sysinternals Process Explorer can also do good real-time views. Also in the Sysinternals suite are things like DIskMon which do low-level tracing of IO – not sure if this is still supported tho.