Monitor your Network the Open Source way with Etherape
Every network administrator needs a good network monitor for network management. But with so many to choose from it's hard to know which one is best. This especially applies to the open source world. Go to Freshmeat.net and you will find 191 entries for open source network analyzers and network tools. Of those many are console based. Of those entries one monitor stands out as both powerful and easy to use. That tool? Etherape.
Etherape is a graphical network monitoring tool based on etherman that features link-layer, tcp, and ip modes. Etherape is a real time monitor who's graphic representation instantly changes as network traffic goes in and out. You can use Etherape live or have it read from a dump file. Etherape supports Ethernet, FDDI, Token Ring, ISDN, PPP and SLIP devices so you shouldn't have any problem getting it to work on your network.
Installing
Installing Etherape is simple. Open up your Add/Remove Software utility, do a search for "etherape" and select the entry when it appears. Apply the changes to install the application. If you prefer to go the command line route you can isse the command "sudo apt-get install etherape". Once you have the application installed you can start Etherape by issuing the command etherape from a command line. You can also start Etherape from the Applications menu by looking in the Tools | System Tools submenus.
The Main Window
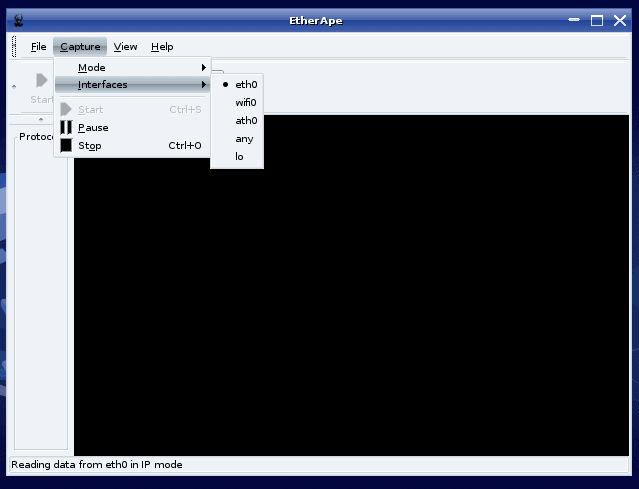
When you first open up Etherape (you will need the root password) you will see a blank window with some buttons and menus. At this point you are not capturing any packets because you haven't instructed Etherape what interfaces to use.

In order to configure the interface click on the Capture menu and then click in the Interfaces sub-menu. Select the interface your machine uses to continue. Note that, as of this writing, Etherape does not support the Wifi0 interface. If you are using wireless you will most likely be able to use ath0.
Once you have configured the interface select the Mode type from the same menu you found the Interfaces entry.
Etherape will immediately begin capturing packets. You will see the large black window quickly fill with traffic. Depending upon your network your window can fill up very quickly. You will also notice that Etherape contains a color-coded legend.
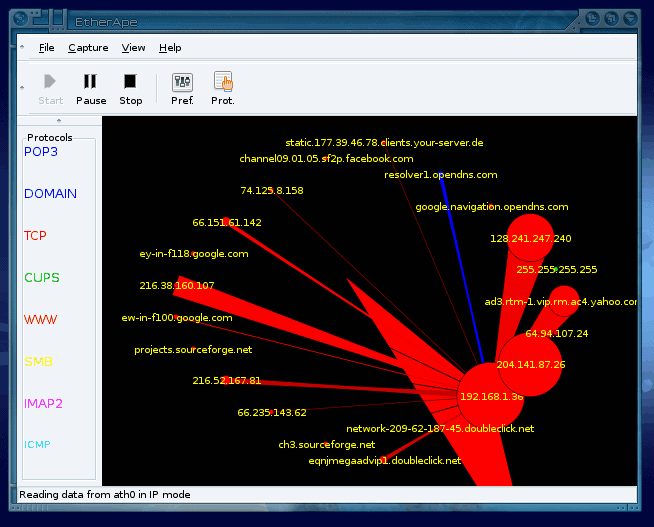
By default CUPS and Domain are blue, WWW, TCP, ICMP are red, IMAP2 is purple, and POP3 is yellow. These colors can be changed in the Preferences window to whatever you like.
As you can see (in the image to the right) there is a lot of external traffic. But what if you only want to monitor internal traffic? Simple In the Preferences window click on the Diagram tab. You will see a small text area labeled "Capture Filter". In this text area you will enter something similar to: ip and src net 192.168 and dst net 192.168 (where 192.168 is the first two sections of your internal network addressing.)
Once you enter that information, click Save, and the preferences window will go away. Etherape will now start capturing only your internal traffic.
Reading From Files
Etherape can read files from the tcpdump application. But you must run tcpdump with the -n and -w flags. The tcpdump command would be run like so: tcpdump -n -w dump_file. Once you are satisfied you have enough information you can stop the dump with ctrl-c. Once you have your dump file you can open it by going to File and then selected Open. The captured packets will display in real time as they were captured during tcpdump's run.
Final Thoughts
Etherape is the perfect tool for monitoring network traffic. Not only is it simple to use, it gives you instant output as traffic comes in and out of your network.
Advertisement




‘;cmd=ls