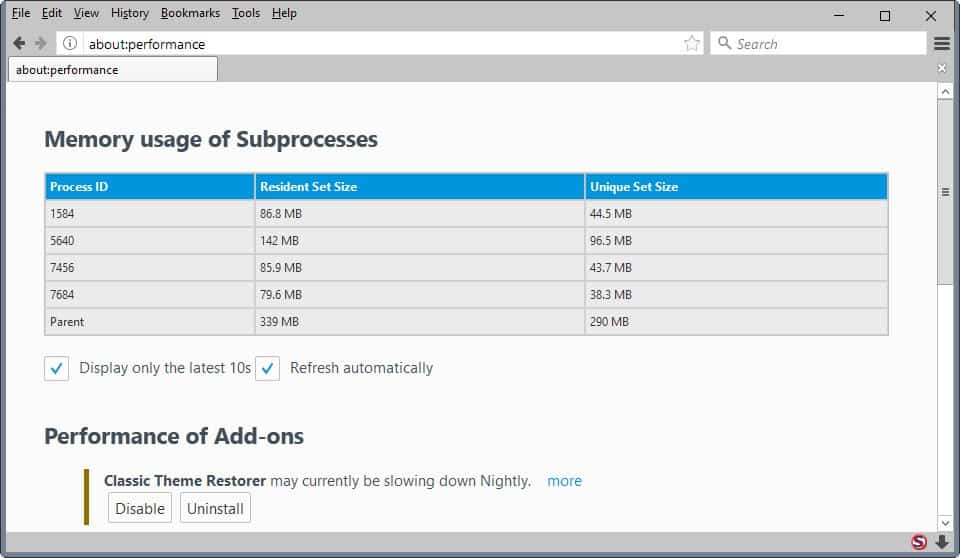
Firefox 51 shows memory usage of individual processes

With multi-process Firefox slowly rolling out to stable channel installations of the browser, further work is done on improving the feature for all Firefox users.
Mozilla made the decision to roll out the new multi-process architecture with a single content process initially that is separated from the browser core.
The company plans to change that by adding more processes to Firefox.The feature needs to be stabilized first however as it is plagued by a couple of bugs currently.
Another improvement that is still in the works is sandboxing which will improve security once it lands.
One core difference between Firefox's multi-process architecture and that of Google Chrome is that Firefox will never use Chrome's one process for every site system. The main reason for that decision is RAM usage, as it can quickly go out of hand.
Mozilla's initial implementation uses about 20% more memory when compared to vanilla Firefox without multi-process enabled.
Memory usage of Subprocesses

Mozilla landed a new feature in Firefox 51 Nightly recently that lists the memory usage of each process in the browser itself.
All you need to do is load about:performance in Firefox to get a listing of each process, and the memory it uses.
If you have not changed the number of processes, you get one parent process and another that is used for the content listed on the page.
Each content process is listed with its process ID which makes identification easier. While there is no option to deal with a process right from the about:performance page, you may open the Task Manager to locate and kill a misbehaving process using its ID; this should not have any effect on the parent process or other processes used by Firefox.
The new feature is comparable to Chrome's Task Manager which lists memory use and process IDs as well. Chrome however has options to end a process right from within the Task Manager, and it lists network and cpu use of each process on top of that.
One issues with Firefox's memory usage listing on the page is that there is no indication about the sites that are open in any given content process. It would be useful to have a listing of each site open in a content process, as it may help analyze why RAM usage shot through the roof.
It will take a while before the new feature lands in Firefox Stable. (via Sören)


i was wondering, if i have a default value “1” on ff50 then i manually modify the value to “4”
if in ff51 the default value is set to “3”
will i will keep my manually set value or will the update overide the value ?
Does this mean we will be able to kill an individual website if it crashes without taking down the whole browser? Meaning each website will have its own process, which you can identify and kill from task manager? If not, that’s the way it should be and I hope it is in the future. Every video I view on TMZ.com crashes Firefox. I can play other Flash videos fine, but that site ALWAYS crashes! Anybody else have that problem? I think it might be because of Ublock Origin blocking an ad or something that makes it crash.
Try reproducing the issue by disabling one add-on at a time to find the culprit. If you have too many you can try the “Restart Firefox with add-ons disabled” mode first.
I tried to run a video but it apparently requires allowing dubious ad agencies to use plugins so I’d rather not right now, sorry.
One content process owns several tabs, so if one crashes the process, all owned tabs go with it. Happens with Chrome too when you have enough tabs active, I think they watered down their “One process per tab” paradigm because it wastes too much RAM.
You won’t be able to kill individual sites as Firefox won’t use one content process per site.
dom.ipc.processCount = 1000
What was that? Individual sites won’t use a process each you say?
Not if you open 1001 sites.
If they can keep the RAM consumption low I’m fine with it. I’ll be fine with a little more resource-usage, but not as much as Chromium derivatives need. I wonder if anyone compared “old” and “new” FF with the same tabs open.
Stats from February 2016 with 30 active tabs:
+10-20% with one content process, which is how multi-process is going to be in the beginning.
+75% with 4 content processes
+140% with 8 content processes
The 10-20% increase is a goal set in stone. I don’t know how many content processes they will end up using or if and how much they improved memory consumption since February. (Full e10s should be rolled out in May 2017 ?)
But there’s a limit on how much improvement they can make. I would ideally prefer to keep RAM consumption as it is right now without e10s, but since a choice has to be made, I’m okay up to +75% MAXIMUM. After that I would need to buy RAM to keep using my other apps properly.
(No way I’m using Chrome if only for this reason.)
Thank you. I’m in a similar situation, if I’m using Chromium based browsers it’s like the rest of my system slows down. If it’s +140% with 30 active tabs it doesn’t sound too bad. Let’s wait and see, then.
It won’t be much of an information for a lambda user. Personally I avoid real-time stats, system information and search for information only if I fear a failure somewhere (i.e. RAM usage when I had only 4MB available). But more real-time information and its accessibility proves to be an oasis for power users who follow the system and its components as an anaesthetist follows a surgery (word of the day!).
I have to expect they’ll be making it more useful than this.
These seems like just the beginnings of a process manager.
Yep, it is in Nightly so there is a chance that this will improve over time.