Mozilla's Browser Toolbar makes Firefox interface customizations easier

If you are a regular here on Ghacks Technology News you probably know that it is possible to customize the Firefox user interface in many different ways. In fact, of the big five -- Firefox, Internet Explorer, Chrome, Opera and Safari --Â it is without doubt the most customizable browser, and that by a large margin.
While it is possible to install browser extensions to modify certain elements or features of Firefox, the Classic Theme Restorer extension comes to mind for example, it is also possible to use CSS directly by placing it in a file called userChrome.css in the Firefox profile directory.
This may especially be useful when the new Firefox interface design Australis comes along, as it changes many elements of the browser.
Browser Toolbox for Firefox
Browser Toolbox is an improved version of the Browser Debugger tool that has been part of Firefox for quite some time. Browser Debugger is not available by default, but needs to be enabled first by making configuration changes in the Developer Tool settings.
Side Note: It has been in Firefox since version 19, but needed to be enabled back then by setting the two preferences devtools.chrome.enabled and devtools.debugger.remote-enabled to true.
The improved Browser Toolbox has not yet been integrated into Nightly. It will however make an appearance very soon if things go as planned.
Do the following to activate Browser Debugger / Browser Toolbox
- Tap on the Alt-key to bring up the menu bar and select Tools > Web Developer > Web Console.
- Click on the settings icon in the upper right corner of the screen.
- Locate "Enable chrome debugging" and "Enable remote debugging" and make sure that both items are checked.
- Close the Web Console.
You should now have a new Browser Debugger or Browser Toolbox link in the Web Developer menu depending on which version of Firefox you are using. When you run it, you will receive a warning message that "an incoming request to permit remote debugging was detected". You need to click ok to continue.
Note: Clicking disable will disable remote debugging in Firefox. Cancel will simply cancel the current operation, but keep the feature enabled.
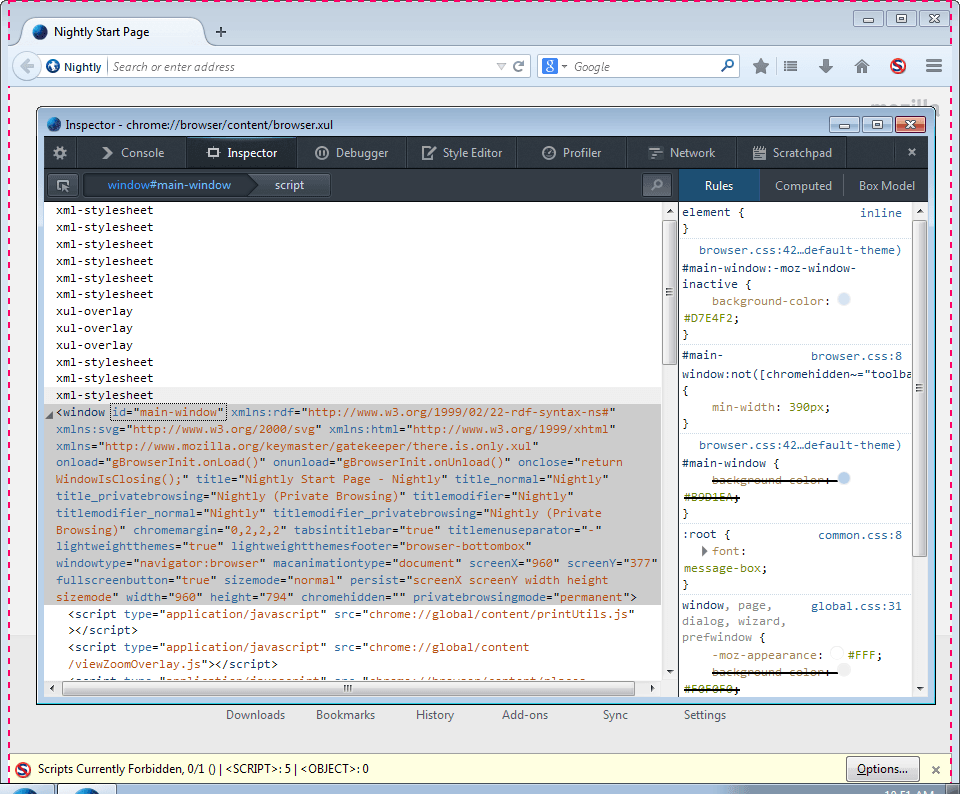
Once you have clicked on ok, the Browser Debugger window is launched separately.
The window will display lots of code, and if you are not familiar with it, at least a bit, you will probably be lost here as you do not know where to go from here.
The thing that appears to be new in the most recent version of Firefox is that you can now use the Toolbox in combination with other web developer tools. It is now integrated into the developer window, so that you can use tools like the inspector or style editor to test interface modifications.
You are probably wondering how this is different from the Dom Inspector extension, which you can use to look up Firefox interface IDs as well to manipulate them using CSS.
The core difference is that Dom Inspector is an extension, while Browser Toolbox is integrated into Firefox directly. With the integration of Browser Toolbox, it is now possible to use the tool in pretty much the same way as you would use Dom Inspector.
The feature has a couple of shortcomings right now. You cannot switch windows for example using it, and it is not working when you try to check out the Developer Tools interface.
Closing Words
Mozilla continues to improve the Web Developer tools in the Firefox web browser which do not only benefit developers but also regular users, as you can do all kinds of great things using them. This includes finding out which add-ons manipulate websites you visit, or use the Developer Toolbar to remove or edit cookies, take screenshots, manage Firefox add-ons, or change Firefox preferences. (via Sören)
Advertisement


I give up. When I hit the Alt-key, the file tab in the upper left corner is highlighted. When I go Tools>WD>WC, after about 3 min., a screen named Scratchpad comes up (or nothing does), and I can assure you, it has no settings icon. What am I doing wrong?
Can I use this to reduce the height of the toolbar in Australis?
This is the first I heard of this. I’ll give it a try when it comes to Australis. Thanks for the tip. Maybe I won’t screw up my browser to the point of being completely unusable. :;
It is in Nightly now and I didn’t get the Incoming Message confirm box.