A look at Firefox's new Network Monitor

Network Monitor is a new weapon in Firefox's Web Developer arsenal that recently made its way into the beta version of the browser. Beta, Aurora and Nightly versions of Firefox support the feature already with the Stable version receiving access when it is updated to Firefox 23.
To start Network Monitor, use the shortcut Ctrl-Shift-Q or select it by clicking on Alt and selecting Tools > Web Developer > Network from the menu that opens up.
The web developer window opens up in network view. You can keep the window independent from Firefox or use the small buttons on the right of the menu bar of it to snap it to the bottom or side of the browser window.
Note that network only works on the tab that was active when you opened it and not on other tabs.
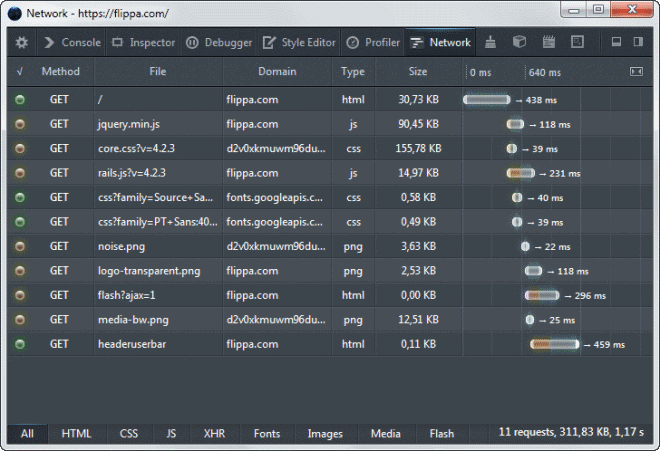
The monitor displays all requests the browser makes when a web page is loaded in it. Each request is listed with its request method, file, domain the information are retrieved from, type of data, size, and the loading time. The colored icons at the beginning of the line display the response header, with green indicating that everything is ok. The yellow icons in the screenshot above detailed that the resources were not modified (304). Errors such as 404 not found are indicated with red icons.
You can filter for specific types of data at the bottom, for instance to display only the loading time of JavaScript code or images (landed in Firefox 24 so not in the BETA right now).
The loading time of individual elements works similar to how page load testing scripts work. You can use it to find the longest loading items on a web page. It may also help you find out if there are bottlenecks on the page, elements that block others from being loaded until they are loaded in full.
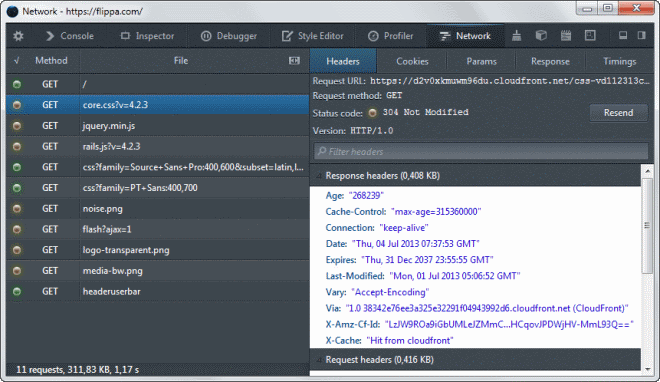
A click on a request displays information about it in a sidebar on the screen. Here you get access to all headers, cookies, parameters, the contents and timings.
- Headers - Displays all headers of the item. This can be very useful to check the content encoding, caching and other information to make sure it is configured correctly.
- Cookies - If cookies are saved by the requested item, they are listed here with their SID and token.
- Parameters - If parameters are added to requests, they are listed here. Great if you are debugging requests.
- Response - What is been requested, e.g. the HTML body or CSS stylesheet. Images are displayed here too
- Timings - Displays all timings including DNS resolution, connecting, sending, waiting and receiving timings.
Closing Words
The Web Developer tools are constantly being worked on by Mozilla. The addition of a Network Monitor is yet another useful tool that Firefox users have now in their arsenal.
Firebug users who are working on older machines may find this reason enough to switch to free up some RAM in the process.
Advertisement


firefox is getting better all the time in some ways and way worse in others.
just wish the gave more respect and appreciation and help to some of the add-on authors that kept firefox alive. some of my favorite add-ons are dying because of the back-end changes they are making. mozilla is giving zero support to the lower tier long time authors. firebug has be in the upper tier for awhile but they are getting pushed out the door by another method.
to be honest firefox needs to have all of firebug built in to it plus more.
it just really sucks for all the people apart of firebug.
Chrome has this feature for years.
Open Google Chrome – load a web site – F12 – Network tab – reload page – watch the magic unfold.
Wow, I didn’t even know!! Magic indeed.
It’s called Firebug. It’s been around for 6 years or so.
it’s impressive how much added functionality for developers there is in a standard installation of firefox/nightly,i, as a more mainstream user, don’t even really know of.