Monitor your network with iptraf
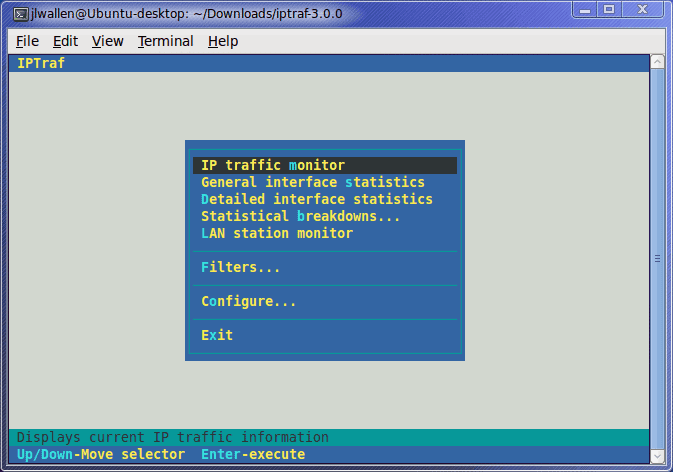
I am always looking for a good network monitor, and there are plenty out there. But in all my years of searching I have yet to come across a monitor as good as the tried and true iptraf. The iptraf network monitor is an ncurses-based IP LAN monitor (so it's text-based) that is interactive and generates network statistics such as: TCP info, UDP counts, ICMP and OSPF information, Ethernet load info, node stats, IP checksum errors, and more.
Now, the only issue with iptraf is that it is old. It hasn't been updated since 2005 (as far as I can see). But being old doesn't mean it isn't useful. The iptraf tool still installs, still runs, and is just as useful as it was when it was still in active development. And because iptraf is still a useful tool, I thought I would show how it is installed and used on a modern Linux distribution.
Installation
Installation is simple. The iptraf tool should be found in your distribution's repositories. So open up Synaptic (or gnome-packagekit, or whatever tool you prefer to install with) and follow these steps:
- Search for "iptraf" (no quotes).
- Mark iptraf for installation.
- Click Apply to install.
That's it. Now you are ready to run the tool.
Usage
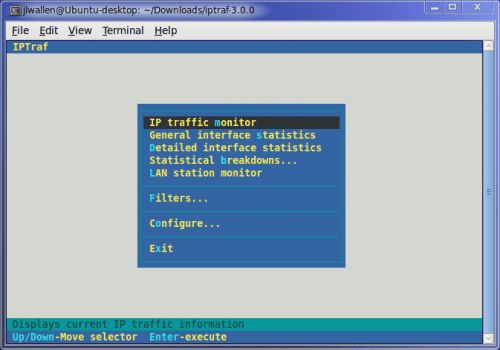
Using iptraf requires root (or sudo) privileges. It also requires a terminal window. So open up your favorite terminal window and issue the command sudo iptraf. When you run iptraf you will see information about the license and copyright. All you need to do is press a key to get beyond this screen.
The next screen you will see is the options window. From here you can just start up a traffic capture or you can set some options and/or filters you can gather general or detailed interface statistics, or you can gather statics on a LAN station.
Let's take a look at creating a filter for monitoring. Let's say you want to watch web traffic on a web server. To do this scroll down to the Filters entry and hit Enter. In the next screen you can choose from IP, ARP, RARP, and Non-IP. Select IP and then, from the resulting screen, select Define new filter.
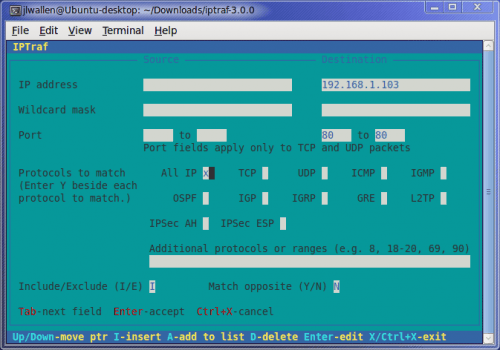
The first step to defining the new filter is to give the filter a description. Enter something like "Web Traffic" (no quotes) and hit Enter. It will now seem like all you have done is create a filter with no rules (just a name). Hit the i key to Insert rules into your new filter. This new screen (see Figure 2) allows you to enter rules for both source and destination. You have to tab around to get to the fields you want. For the IP address(es) just enter the address, for the ports enter the start and ending numbers, and for the protocols you tab to the protocol you want to include and then hit the "y" key (no quotes).
Once you have saved the filter you will find yourself in the Filter list. Follow these steps to start monitoring with your new filter:
- Hit <Ctrl>x to get out of this screen.
- Scroll up to Apply filter.
- Select the new filter and hit Enter.
- Exit all of the menus until you are back at the main window.
- Select IP traffic monitor and hit Enter.
- Select the interface you want to monitor and hit Enter.
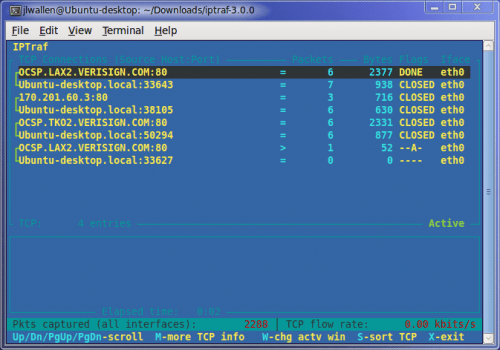
Watch the action (see Figure 3) occur in real time. The nice thing about iptraf is that its small size allows for perfect real-time, constant monitoring on a network from a single machine.
Final thoughts
I realize that iptraf is WAY out of date. But the fact that the tool still works as well as it did when it was in active development say a lot about how well this tool was made. And although many might balk at using a tool that is no longer being worked on, in the case of iptraf it's not so much an issue. It still works and it still works well.
Advertisement







You can also try ProteMac Meter.
actually i didn’t knew it but it seem nice.
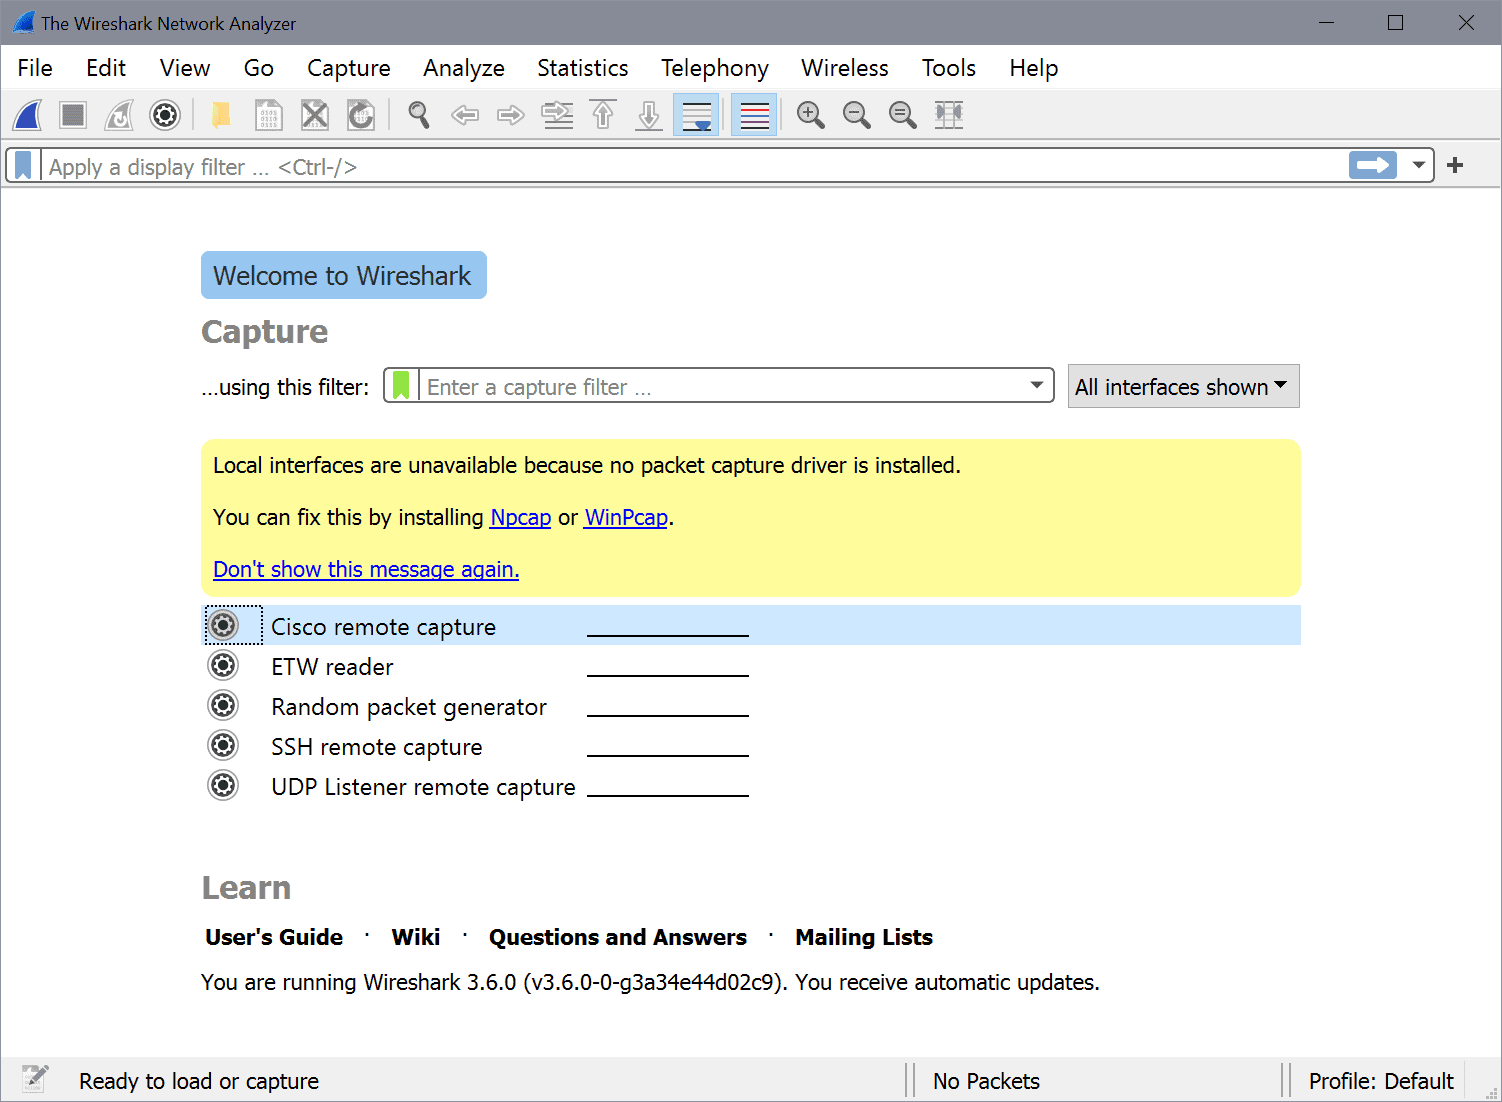
though it’s obsolete. wireshark is way better (and way more complicated then this).
and simple net\lan tools will give you the same info…
I had no idea iptraf was out of date; I use it at least once a week and it always serves me well. Maybe the developer(s) just believe it to be feature complete and have no need to add more to the program? It isn’t like closed apps where they need to sell more.
What would be a good program (preferably freeware) like this for Windows?
Wireshark.