Some helpful, but obscure, Linux admin tools

Linux is resplendent with administration tools. No matter what you need to monitor, Linux has a tool to suit your needs. You can monitor everything from file I/O, to network processes, and everything in between. You can test systems, check systems, start and stop systems...you name it. There are so many tools it's hard to know where to start. And some of those tools are not very well known. Of those lesser known tools, some of them are incredibly helpful.
I want to introduce you to a few of these handy, but little-known, Linux administration tools.
w
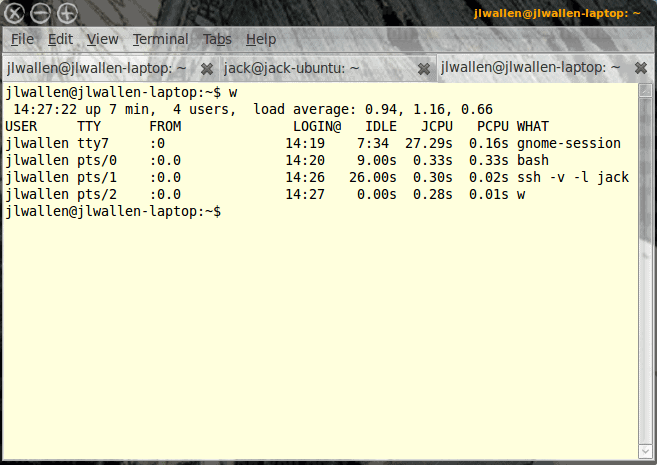
The w command is a very simple tool that displays to you who is logged onto a system, when they logged in, and what processes they are using. This command is incredibly simple to use, just issue the command w and you will receive output similar to that shown in Figure 1.
As you can see the user jlwallen (that's me) has been logged in since 14:19 and has four processes running.
iostat
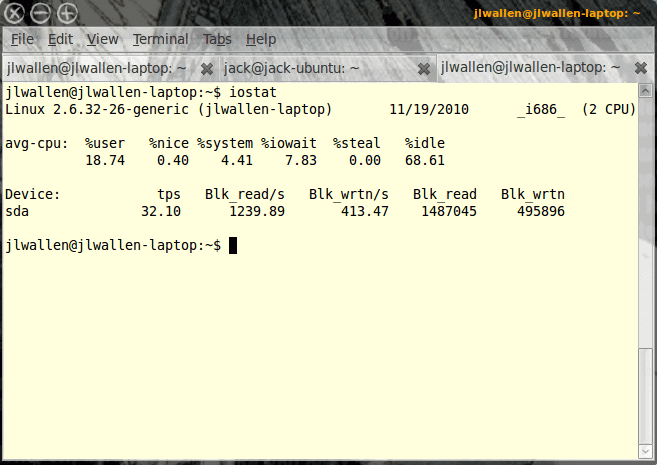
The iostat command (part of the sysstat program) will report CPU statistics and I/O statistics. As you can see, in Figure 2, iostat is broken into three sections:
Information: Information about kernel, hostname, date, and architecture.
Avg-CPU: This section gives you all of the information about your CPU on different levels (user, system, I/O, involuntary wait, and idle).
Device: This section offers statistics on a per physical device basis.
mpstat
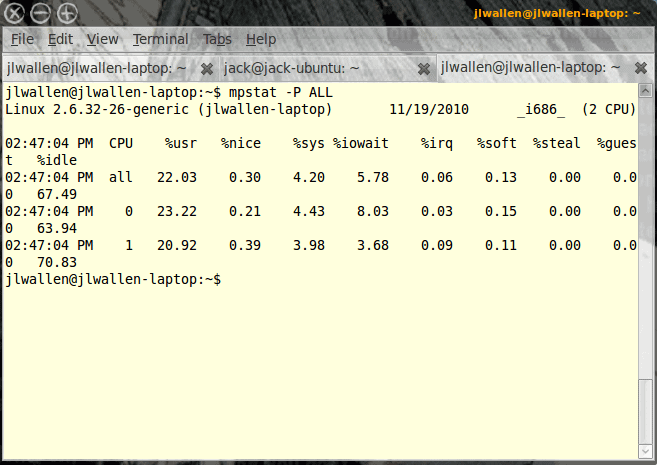
The mpstat command will display a per-processor listing of processes. If you issue the command mpstat -P ALL you will see a listing of your processes for each CPU (see Figure 3). This command will report processes on a user, idle, nice, system, irq, involuntary wait, and guest level.
Instead of running this on all processors you can specify a processor with the -P argument.
pmap
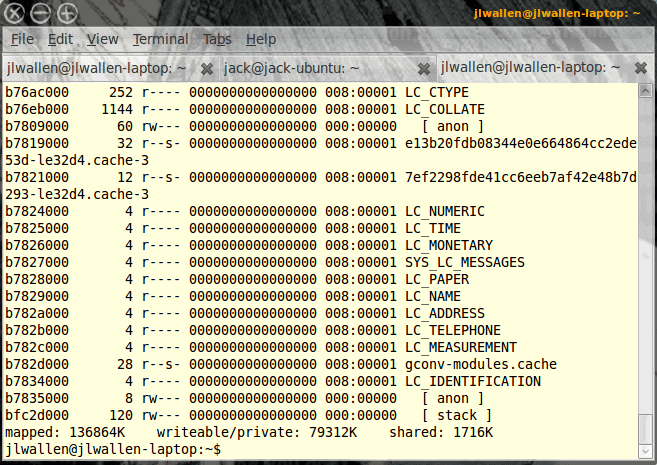
This tool is more used for developers as it will report bottlenecks in memory. You have to use it on a process ID (PID) like so:
pmap -d PID
Where PID is the actual process ID of the program you want to check.
As I already mentioned, the information output from this command will be helpful for developers and not much more.
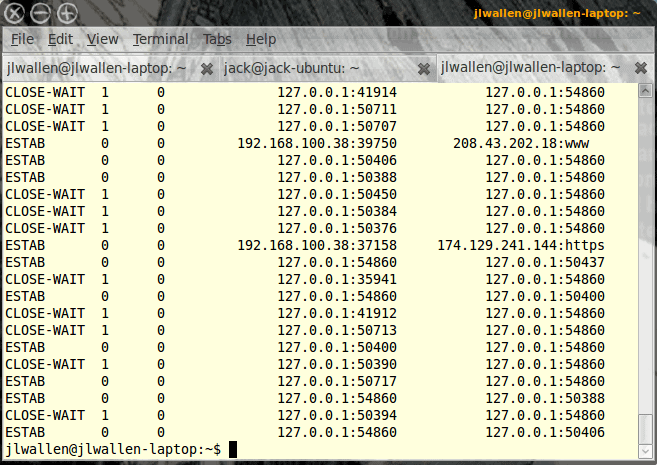
ss
The socket statistics command will give you output of all network sockets on your system. As you can see (in Figure 5) there are a lot of sockets to list on the average computer. This command is similar to netstat but is much faster at reporting. Figure 5 illustrates how ss does its reporting. Here you see localhost as well as some private IP addresses connecting to sockets on this particular machine.
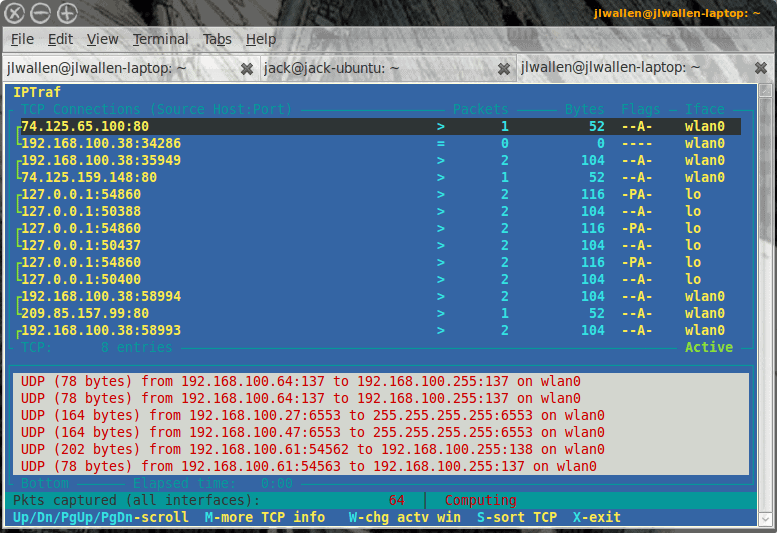
iptraf
The iptraf tool is one of my favorite text-based network monitoring tools. You won't find iptraf installed by default (it's generally in the default repositories for distributions, so it's easy to install). Once you have iptraf installed you can start it by issuing the command iptraf. This tool allows you to create filters which can monitor specific network devices, addresses, packets, ports, and more.
Conclusion
The Linux operating system offers a ton of administration tools. Since many of those tools are commands, they wind up disappearing in obscurity. Here you have seen a few of those obscure commands. If you need more information on any of these commands you can check out the man page for each.
Advertisement


Nice post, I’d suggest iftop as an alternative to iptraf.
wow. did not know about some of these. nice post..thx!